1. EKS Monitoring(모니터링) vs Observability(관측 가능성) 비교
2. 실습환경
3. EKS Console
- 3.1 Logging in EKS
4. Container Insights metrics in Amazon CloudWatch & Fluent Bit (Logs)
- 4.1 CloudWatch Container observability 설치
5. 프로메테우스-스택
6. 그라파나 및 그라파나 Alert
7. 후기
1. EKS Monitoring(모니터링) vs Observability(관측 가능성) 비교
| 모니터링 | 관측 가능성 | |
| 개념 | 시스템의 성능과 상태를 미리 정의된 메트릭과 로그를 통해 확인하는 과정 | 시스템 내부 상태를 심층적으로 분석하고 문제의 원인을 파악할 수 있도록 하는 능력 |
| 초점 | 사전 정의된 지표 및 로그 | 원인 분석 및 예측 가능성 |
| 데이터 유형 | 메트릭(Metrics), 로그(Logs) | 메트릭(Metrics), 로그(Logs), 트레이스(Traces) |
| 예측 가능성 | 문제 발생 여부를 감지 | 문제 발생 원인을 분석 및 예측 가능 |
| 사용 목적 | 서비스 및 인프라 성능 모니터링, 장애 감지 | 애플리케이션 및 인프라의 원인 분석, 근본적인 문제 해결 |
| 도구 예시 | AWS CloudWatch, Prometheus, Grafana | AWS X-Ray, OpenTelemetry, Jaeger, New Relic |
| 적용 방식 | 대시보드와 알람을 통해 운영자가 감시 | 분산 추적과 연계 분석을 통해 실시간 문제 탐지 |
| 핵심 요소 | 수집된 데이터를 기반으로 이상 감지 | 시스템의 내부 상태를 분석하여 문제 해결을 용이하게 함 |
| 자동화 수준 | 설정된 임계값을 초과하면 알람 발생 | 머신러닝 및 AI 기반의 문제 분석 가능 |
- Monitoring(모니터링) 은 현재 시스템이 정상적으로 동작하는지 확인하는 데 중점을 둡니다.
- Observability(관측 가능성) 은 문제가 발생했을 때 근본적인 원인을 분석하고 해결할 수 있는 능력을 제공합니다.
- EKS 환경에서는 Prometheus, CloudWatch, X-Ray, OpenTelemetry 등을 조합하여 모니터링과 관측 가능성을 함께 구축하는 것이 일반적입니다
2. 실습환경 구축
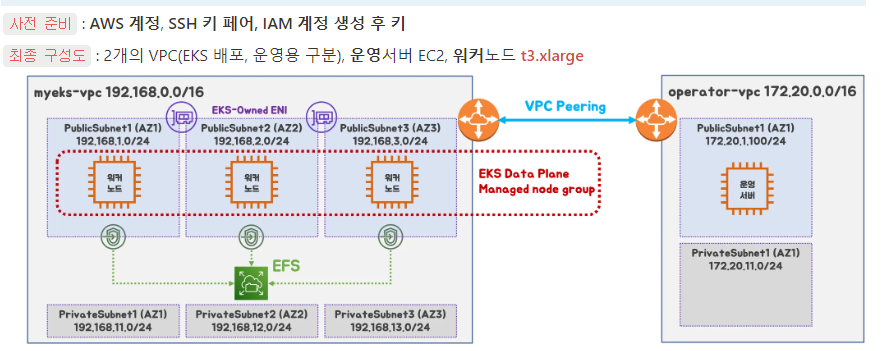
| - curl -O https://s3.ap-northeast-2.amazonaws.com/cloudformation.cloudneta.net/K8S/myeks-4week.yaml 변수 셋팅 후 스텍을 생성 - aws cloudformation deploy --template-file myeks-4week.yaml --stack-name $CLUSTER_NAME --parameter-overrides KeyName=$SSHKEYNAME SgIngressSshCidr=$(curl -s ipinfo.io/ip)/32 MyIamUserAccessKeyID=$MYACCESSKEY MyIamUserSecretAccessKey=$MYSECRETKEY ClusterBaseName=$CLUSTER_NAME WorkerNodeInstanceType=$WorkerNodeInstanceType --region ap-northeast-2 |
| ssh -i ssh-250209.pem ec2-user@$(aws cloudformation describe-stacks --stack-name myeks --query 'Stacks[*].Outputs[0].OutputValue' --output text) |
운영서버에 접근 후 EKS가 설치되는 것을 확인.
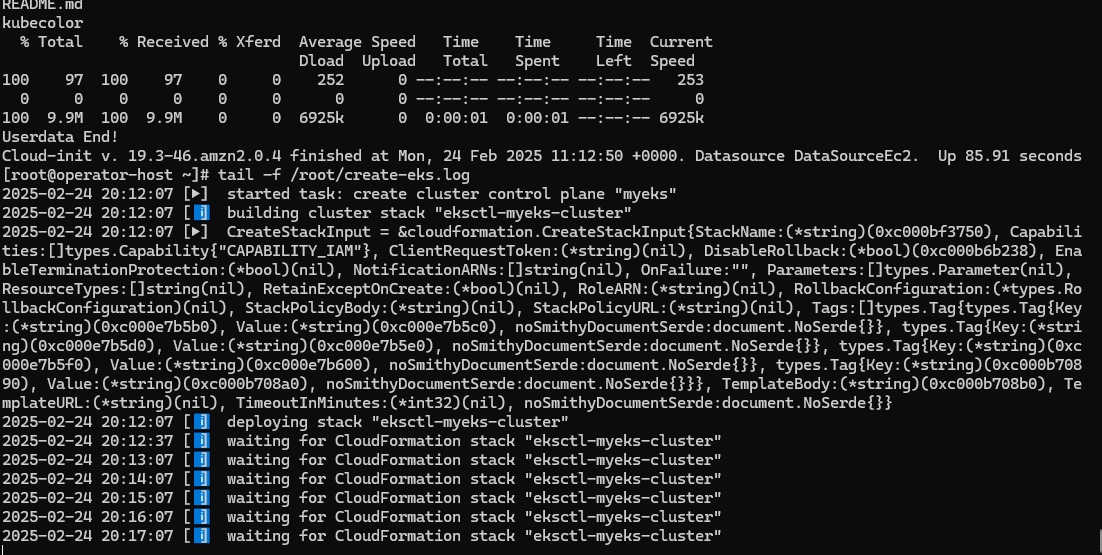
- 생성 확인 후 kube Config 등록
| aws eks update-kubeconfig --name myeks --user-alias $(aws sts get-caller-identity --query Arn --output text) export CLUSTER_NAME=myeks export VPCID=$(aws ec2 describe-vpcs --filters "Name=tag:Name,Values=$CLUSTER_NAME-VPC" --query 'Vpcs[*].VpcId' --output text) export PubSubnet1=$(aws ec2 describe-subnets --filters Name=tag:Name,Values="$CLUSTER_NAME-Vpc1PublicSubnet1" --query "Subnets[0].[SubnetId]" --output text) export PubSubnet2=$(aws ec2 describe-subnets --filters Name=tag:Name,Values="$CLUSTER_NAME-Vpc1PublicSubnet2" --query "Subnets[0].[SubnetId]" --output text) export PubSubnet3=$(aws ec2 describe-subnets --filters Name=tag:Name,Values="$CLUSTER_NAME-Vpc1PublicSubnet3" --query "Subnets[0].[SubnetId]" --output text) export N1=$(aws ec2 describe-instances --filters "Name=tag:Name,Values=$CLUSTER_NAME-ng1-Node" "Name=availability-zone,Values=ap-northeast-2a" --query 'Reservations[*].Instances[*].PublicIpAddress' --output text) export N2=$(aws ec2 describe-instances --filters "Name=tag:Name,Values=$CLUSTER_NAME-ng1-Node" "Name=availability-zone,Values=ap-northeast-2b" --query 'Reservations[*].Instances[*].PublicIpAddress' --output text) export N3=$(aws ec2 describe-instances --filters "Name=tag:Name,Values=$CLUSTER_NAME-ng1-Node" "Name=availability-zone,Values=ap-northeast-2c" --query 'Reservations[*].Instances[*].PublicIpAddress' --output text) export CERT_ARN=$(aws acm list-certificates --query 'CertificateSummaryList[].CertificateArn[]' --output text) #사용 리전의 인증서 ARN 확인 MyDomain=hey-aws.click # 각자 자신의 도메인 이름 입력 MyDnzHostedZoneId=$(aws route53 list-hosted-zones-by-name --dns-name "$MyDomain." --query "HostedZones[0].Id" --output text) |
- kube-ops-view(Ingress), AWS LoadBalancer Controller, ExternalDNS, gp3 storageclass 설치
| # kube-ops-view helm repo add geek-cookbook https://geek-cookbook.github.io/charts/ helm install kube-ops-view geek-cookbook/kube-ops-view --version 1.2.2 --set service.main.type=ClusterIP --set env.TZ="Asia/Seoul" --namespace kube-system # gp3 스토리지 클래스 생성 cat <<EOF | kubectl apply -f - kind: StorageClass apiVersion: storage.k8s.io/v1 metadata: name: gp3 annotations: storageclass.kubernetes.io/is-default-class: "true" allowVolumeExpansion: true provisioner: ebs.csi.aws.com volumeBindingMode: WaitForFirstConsumer parameters: type: gp3 allowAutoIOPSPerGBIncrease: 'true' encrypted: 'true' fsType: xfs # 기본값이 ext4 EOF kubectl get sc # ExternalDNS curl -s https://raw.githubusercontent.com/gasida/PKOS/main/aews/externaldns.yaml | MyDomain=$MyDomain MyDnzHostedZoneId=$MyDnzHostedZoneId envsubst | kubectl apply -f - # AWS LoadBalancerController helm repo add eks https://aws.github.io/eks-charts helm install aws-load-balancer-controller eks/aws-load-balancer-controller -n kube-system --set clusterName=$CLUSTER_NAME --set serviceAccount.create=false --set serviceAccount.name=aws-load-balancer-controller # kubeopsview 용 Ingress 설정 : group 설정으로 1대의 ALB를 여러개의 ingress 에서 공용 사용 cat <<EOF | kubectl apply -f - apiVersion: networking.k8s.io/v1 kind: Ingress metadata: annotations: alb.ingress.kubernetes.io/certificate-arn: $CERT_ARN alb.ingress.kubernetes.io/group.name: study alb.ingress.kubernetes.io/listen-ports: '[{"HTTPS":443}, {"HTTP":80}]' alb.ingress.kubernetes.io/load-balancer-name: $CLUSTER_NAME-ingress-alb alb.ingress.kubernetes.io/scheme: internet-facing alb.ingress.kubernetes.io/ssl-redirect: "443" alb.ingress.kubernetes.io/success-codes: 200-399 alb.ingress.kubernetes.io/target-type: ip labels: app.kubernetes.io/name: kubeopsview name: kubeopsview namespace: kube-system spec: ingressClassName: alb rules: - host: kubeopsview.$MyDomain http: paths: - backend: service: name: kube-ops-view port: number: 8080 path: / pathType: Prefix EOF |
3. EKS Console
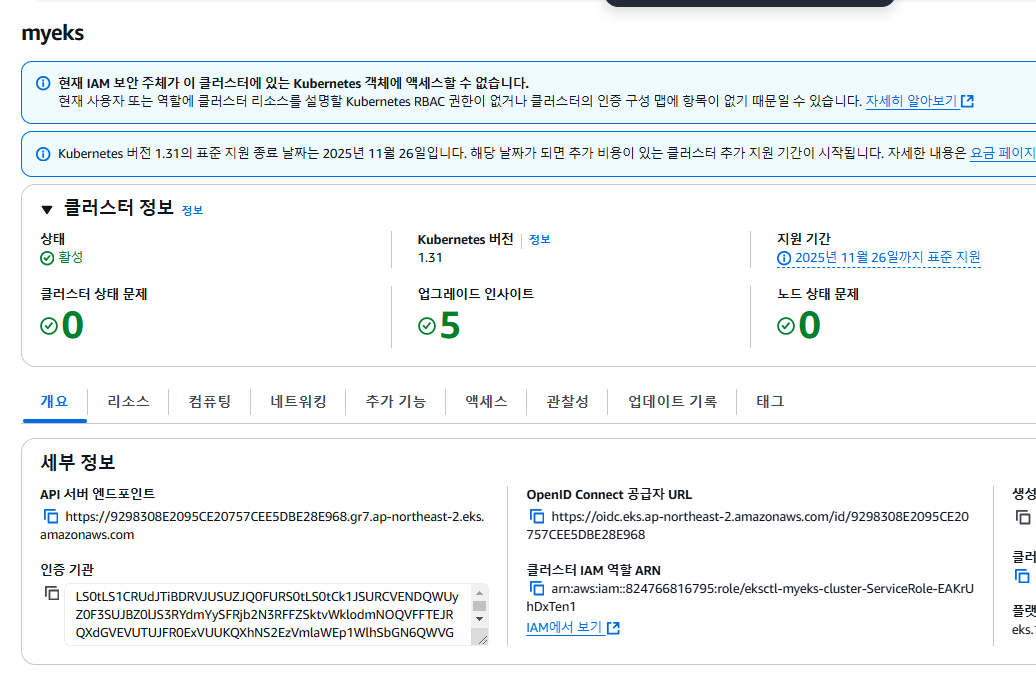
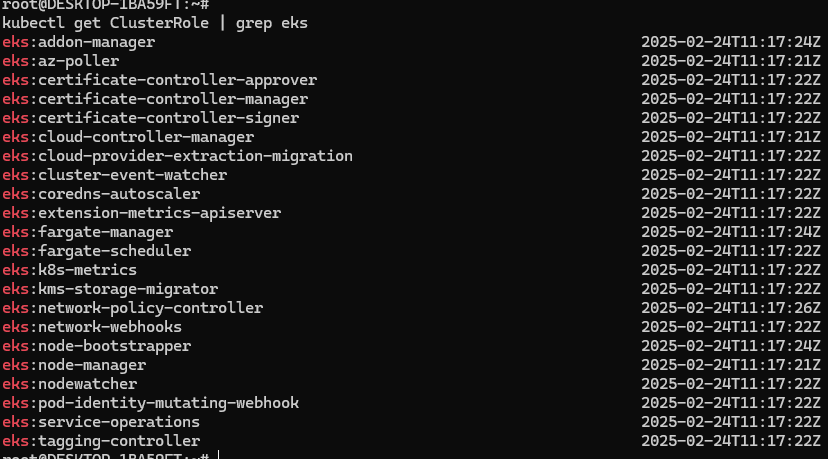
쿠버네티스 API를 통해서 리소스 및 정보를 확인 할 수 있음
현재 상태 및 로그를 확인 할수 있음
3-1. Logging in EKS
로깅을 활성화 후 발생하는 로그를 확인한다.

모든 로그 활성화 aws eks update-cluster-config --region ap-northeast-2 --name $CLUSTER_NAME \ --logging '{"clusterLogging":[{"types":["api","audit","authenticator","controllerManager","scheduler"],"enabled":true}]}' # 로그 그룹 확인 aws logs describe-log-groups | jq # 로그 tail 확인 : aws logs tail help aws logs tail /aws/eks/$CLUSTER_NAME/cluster | more # 신규 로그를 바로 출력 aws logs tail /aws/eks/$CLUSTER_NAME/cluster --follow # 로그 스트림 확인 aws logs tail /aws/eks/$CLUSTER_NAME/cluster --log-stream-name-prefix kube-apiserver --follow aws logs tail /aws/eks/$CLUSTER_NAME/cluster --log-stream-name-prefix kube-apiserver-audit --follow aws logs tail /aws/eks/$CLUSTER_NAME/cluster --log-stream-name-prefix kube-scheduler --follow aws logs tail /aws/eks/$CLUSTER_NAME/cluster --log-stream-name-prefix authenticator --follow aws logs tail /aws/eks/$CLUSTER_NAME/cluster --log-stream-name-prefix kube-controller-manager --follow aws logs tail /aws/eks/$CLUSTER_NAME/cluster --log-stream-name-prefix cloud-controller-manager --follow # 시간 지정: 1초(s) 1분(m) 1시간(h) 하루(d) 한주(w) aws logs tail /aws/eks/$CLUSTER_NAME/cluster --since 1h30m # 짧게 출력 aws logs tail /aws/eks/$CLUSTER_NAME/cluster --since 1h30m --format short CloudWatch Log Insights 확인 # EC2 Instance가 NodeNotReady 상태인 로그 검색 fields @timestamp, @message | filter @message like /NodeNotReady/ | sort @timestamp desc # kube-apiserver-audit 로그에서 userAgent 정렬해서 아래 4개 필드 정보 검색 fields userAgent, requestURI, @timestamp, @message | filter @logStream ~= "kube-apiserver-audit" | stats count(userAgent) as count by userAgent | sort count desc # fields @timestamp, @message | filter @logStream ~= "kube-scheduler" | sort @timestamp desc # fields @timestamp, @message | filter @logStream ~= "authenticator" | sort @timestamp desc # fields @timestamp, @message | filter @logStream ~= "kube-controller-manager" | sort @timestamp desc 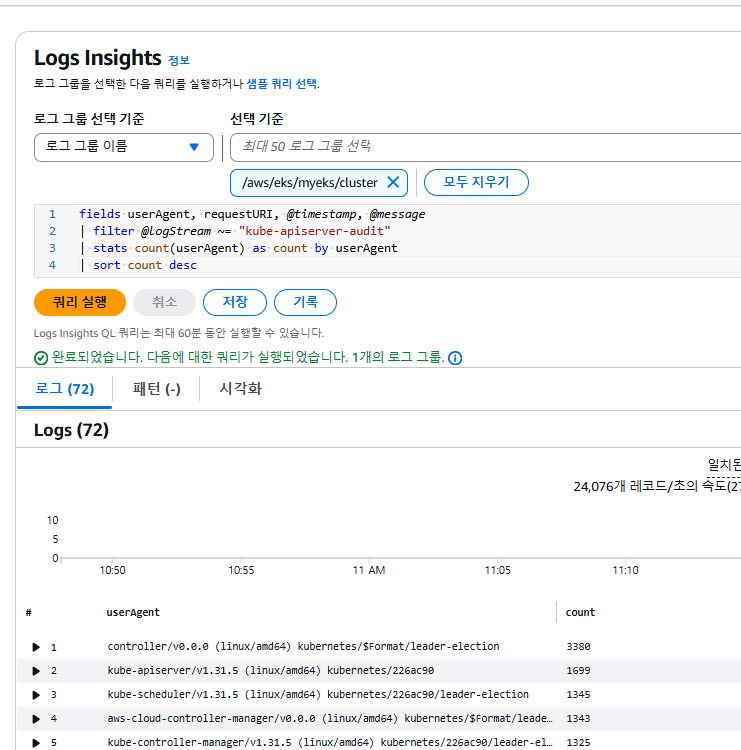 kubectl scale deployment -n kube-system coredns --replicas=1 kubectl scale deployment -n kube-system coredns --replicas=2 scale 했던 coredns 확인 fields @timestamp, @message | filter @message like "coredns" | filter @message like "scaled" or @message like "replica" | sort @timestamp desc 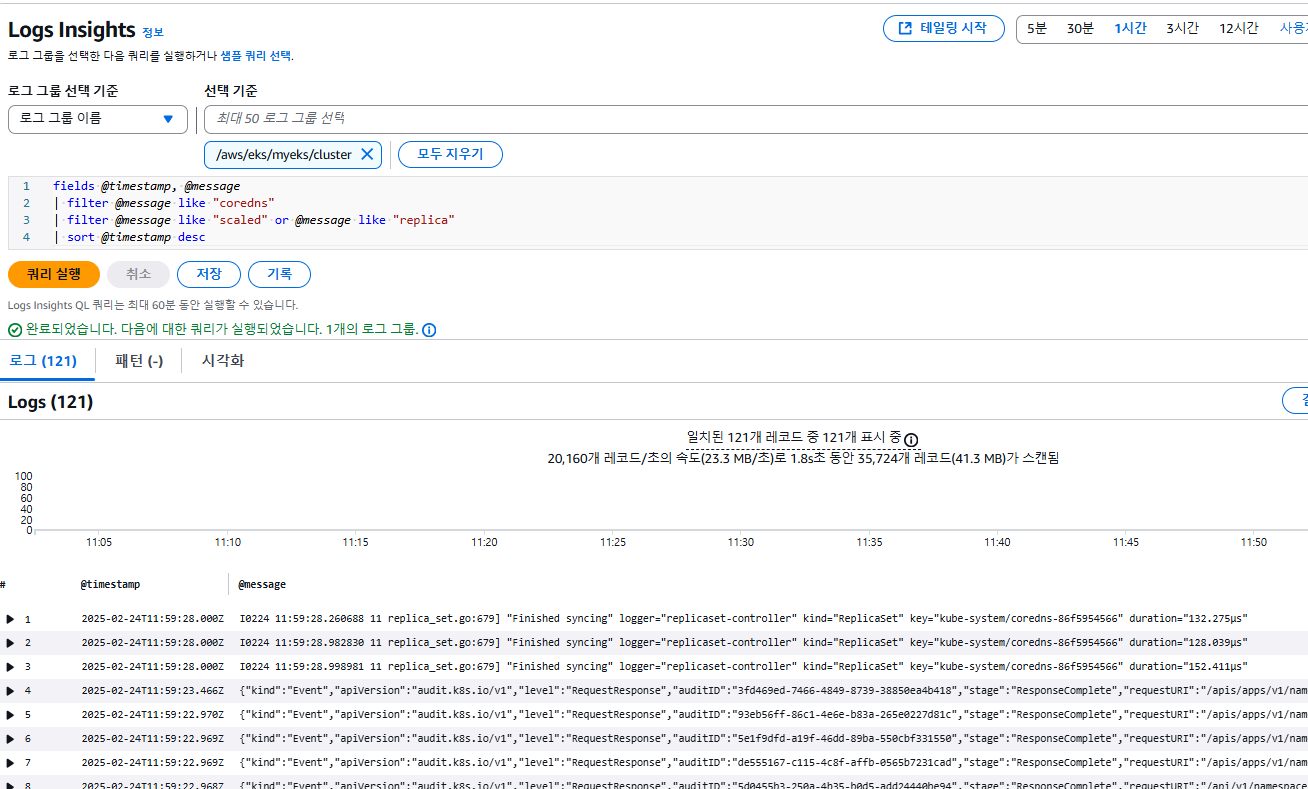 |
3-2. 파드 로깅
| # NGINX 웹서버 배포 helm repo add bitnami https://charts.bitnami.com/bitnami helm repo update # 도메인, 인증서 확인 echo $MyDomain $CERT_ARN # 파라미터 파일 생성 cat <<EOT > nginx-values.yaml service: type: NodePort networkPolicy: enabled: false resourcesPreset: "nano" #가장 낮은 수준의 리소스를 사용한다는 의미 ingress: enabled: true ingressClassName: alb hostname: nginx.$MyDomain pathType: Prefix path: / annotations: alb.ingress.kubernetes.io/certificate-arn: $CERT_ARN alb.ingress.kubernetes.io/group.name: study alb.ingress.kubernetes.io/listen-ports: '[{"HTTPS":443}, {"HTTP":80}]' alb.ingress.kubernetes.io/load-balancer-name: $CLUSTER_NAME-ingress-alb alb.ingress.kubernetes.io/scheme: internet-facing alb.ingress.kubernetes.io/ssl-redirect: "443" alb.ingress.kubernetes.io/success-codes: 200-399 alb.ingress.kubernetes.io/target-type: ip EOT cat nginx-values.yaml # 배포 helm install nginx bitnami/nginx --version 19.0.0 -f nginx-values.yaml # 확인 kubectl get ingress,deploy,svc,ep nginx kubectl describe deploy nginx # Resource - Limits/Requests 확인 kubectl get targetgroupbindings # ALB TG 확인 # 접속 주소 확인 및 접속 echo -e "Nginx WebServer URL = https://nginx.$MyDomain" curl -s https://nginx.$MyDomain kubectl logs deploy/nginx -f 접근 확인 시 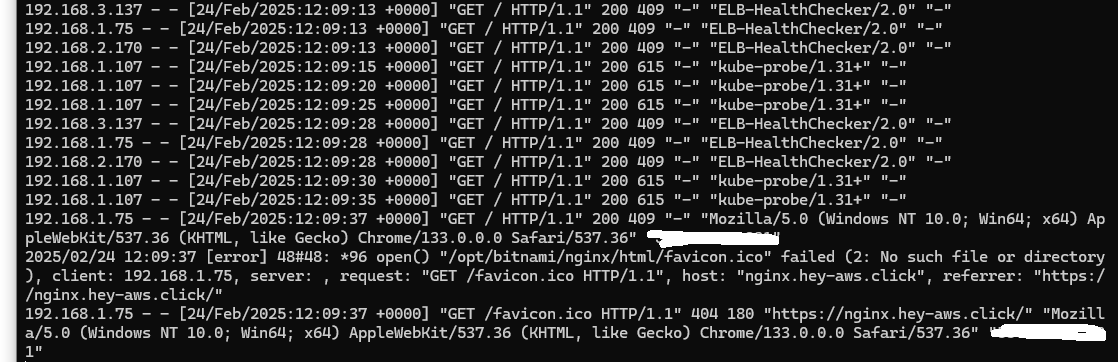 |
4. Container Insights metrics in Amazon CloudWatch & Fluent Bit (Logs)
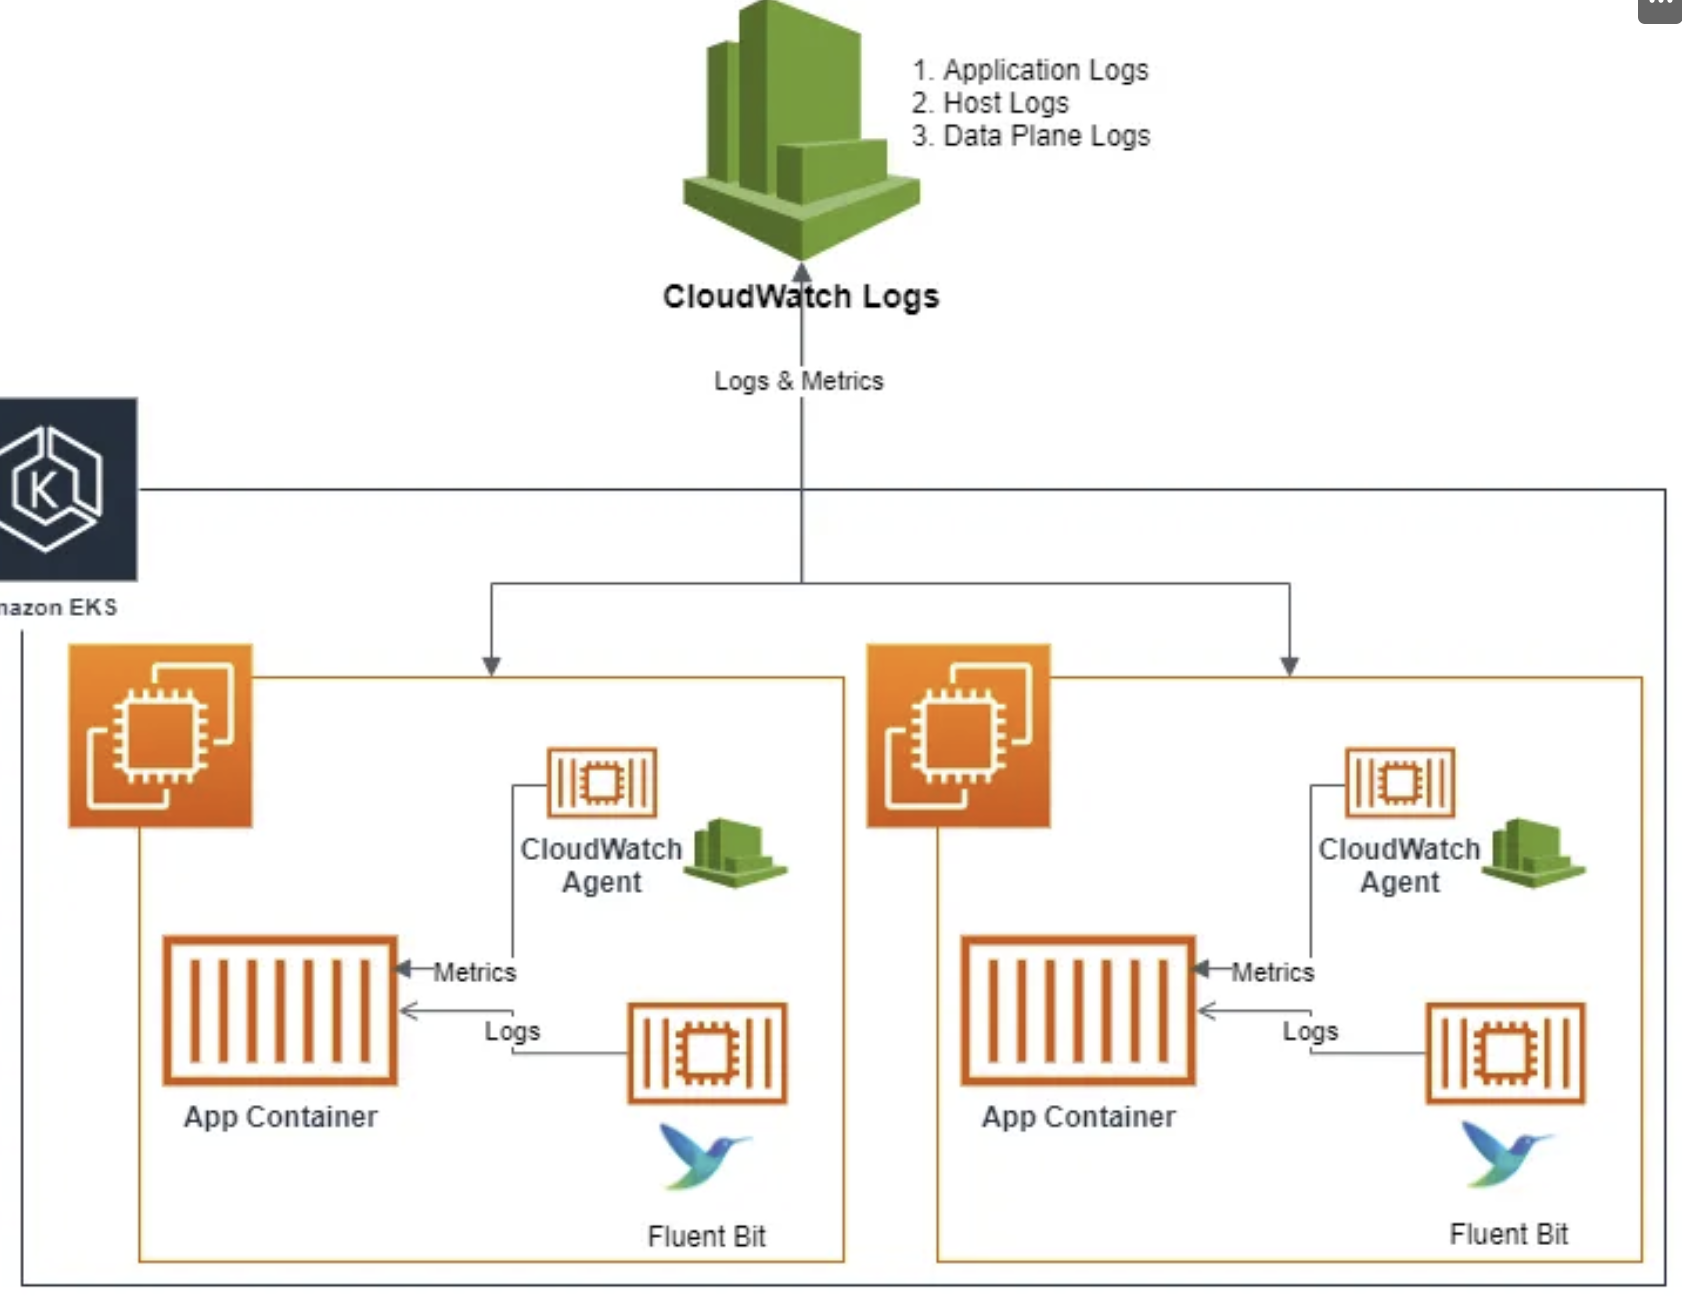
- [수집] 플루언트비트 Fluent Bit 컨테이너를 데몬셋으로 동작시키고, 아래 3가지 종류의 로그를 CloudWatch Logs 에 전송
- /aws/containerinsights/*Cluster_Name*/application : 로그 소스(All log files in /var/log/containers), 각 컨테이너/파드 로그
- /aws/containerinsights/*Cluster_Name*/host : 로그 소스(Logs from /var/log/dmesg, /var/log/secure, and /var/log/messages), 노드(호스트) 로그
- /aws/containerinsights/*Cluster_Name*/dataplane : 로그 소스(/var/log/journal for kubelet.service, kubeproxy.service, and docker.service), 쿠버네티스 데이터플레인 로그
- [저장] : CloudWatch Logs 에 로그를 저장, 로그 그룹 별 로그 보존 기간 설정 가능
- [시각화] : CloudWatch 의 Logs Insights 를 사용하여 대상 로그를 분석하고, CloudWatch 의 대시보드로 시각화한다
- application 로그 소스(All log files in /var/log/containers → 심볼릭 링크 /var/log/pods/<컨테이너>, 각 컨테이너/파드 로그
- dataplane 로그 소스(/var/log/journal for kubelet.service, kubeproxy.service, and docker.service), 쿠버네티스 데이터플레인 로그
| application 로그 소스 # 로그 위치 확인 #ssh ec2-user@$N1 sudo tree /var/log/containers #ssh ec2-user@$N1 sudo ls -al /var/log/containers for node in $N1 $N2 $N3; do echo ">>>>> $node <<<<<"; ssh ec2-user@$node sudo tree /var/log/containers; echo; done for node in $N1 $N2 $N3; do echo ">>>>> $node <<<<<"; ssh ec2-user@$node sudo ls -al /var/log/containers; echo; done # 개별 파드 로그 확인 : 아래 각자 디렉터리 경로는 다름 ssh ec2-user@$N1 sudo tail -f /var/log/pods/default_nginx-685c67bc9-pkvzd_69b28caf-7fe2-422b-aad8-f1f70a206d9e/nginx/0.log dataplane 로그 소스 # 로그 위치 확인 #ssh ec2-user@$N1 sudo tree /var/log/journal -L 1 #ssh ec2-user@$N1 sudo ls -la /var/log/journal for node in $N1 $N2 $N3; do echo ">>>>> $node <<<<<"; ssh ec2-user@$node sudo tree /var/log/journal -L 1; echo; done 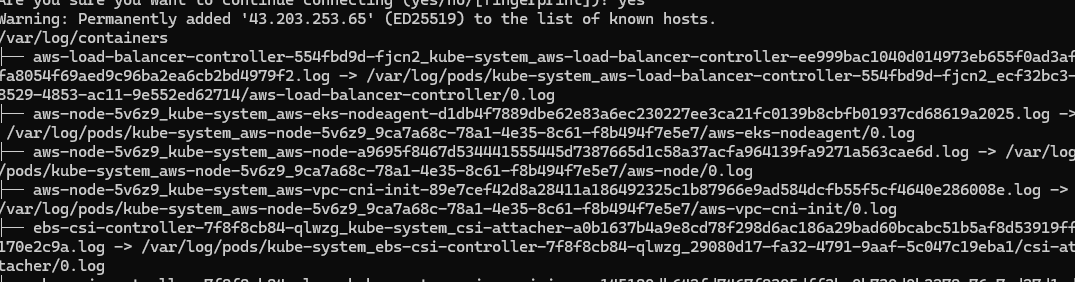 # 저널 로그 확인 - 링크 ssh ec2-user@$N3 sudo journalctl -x -n 200 ssh ec2-user@$N3 sudo journalctl -f |
4.1 CloudWatch Container observability 설치
| # IRSA 설정 eksctl create iamserviceaccount \ --name cloudwatch-agent \ --namespace amazon-cloudwatch --cluster $CLUSTER_NAME \ --role-name $CLUSTER_NAME-cloudwatch-agent-role \ --attach-policy-arn arn:aws:iam::aws:policy/CloudWatchAgentServerPolicy \ --role-only \ --approve # addon 배포 aws eks create-addon --addon-name amazon-cloudwatch-observability --cluster-name myeks --service-account-role-arn arn:aws:iam::<IAM User Account ID직접 입력>:role/myeks-cloudwatch-agent-role # addon 확인 aws eks list-addons --cluster-name myeks --output table 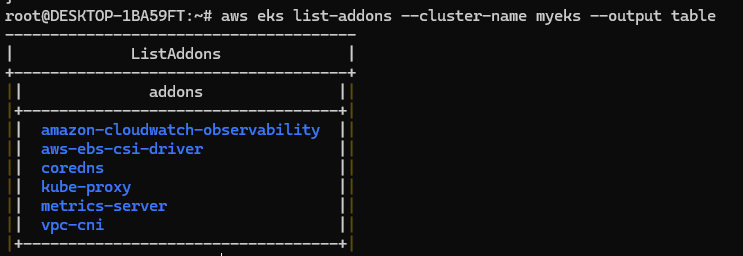 # 설치 확인 kubectl get crd | grep -i cloudwatch kubectl get-all -n amazon-cloudwatch kubectl get ds,pod,cm,sa,amazoncloudwatchagent -n amazon-cloudwatch kubectl describe clusterrole cloudwatch-agent-role amazon-cloudwatch-observability-manager-role # 클러스터롤 확인 kubectl describe clusterrolebindings cloudwatch-agent-role-binding amazon-cloudwatch-observability-manager-rolebinding # 클러스터롤 바인딩 확인 kubectl -n amazon-cloudwatch logs -l app.kubernetes.io/component=amazon-cloudwatch-agent -f # 파드 로그 확인 kubectl -n amazon-cloudwatch logs -l k8s-app=fluent-bit -f # 파드 로그 확인 # cloudwatch-agent 설정 확인 kubectl describe cm cloudwatch-agent -n amazon-cloudwatch kubectl get cm cloudwatch-agent -n amazon-cloudwatch -o jsonpath="{.data.cwagentconfig\.json}" | jq { "agent": { "region": "ap-northeast-2" }, "logs": { "metrics_collected": { "application_signals": { "hosted_in": "myeks" }, "kubernetes": { "cluster_name": "myeks", "enhanced_container_insights": true } } }, "traces": { "traces_collected": { "application_signals": {} } } } 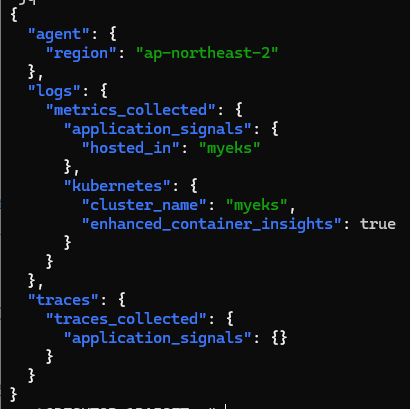 #Fluent bit 파드 수집 ( RuntimeClass...) kubectl describe -n amazon-cloudwatch ds cloudwatch-agent ... Volumes: ... rootfs: Type: HostPath (bare host directory volume) Path: / HostPathType: # Fluent Bit 로그 INPUT/FILTER/OUTPUT 설정 확인 - 링크 ## 설정 부분 구성 : application-log.conf , dataplane-log.conf , fluent-bit.conf , host-log.conf , parsers.conf kubectl describe cm fluent-bit-config -n amazon-cloudwatch ... application-log.conf: ---- [INPUT] Name tail Tag application.* Exclude_Path /var/log/containers/cloudwatch-agent*, /var/log/containers/fluent-bit*, /var/log/containers/aws-node*, /var/log/containers/kube-proxy* Path /var/log/containers/*.log multiline.parser docker, cri DB /var/fluent-bit/state/flb_container.db Mem_Buf_Limit 50MB Skip_Long_Lines On Refresh_Interval 10 Rotate_Wait 30 storage.type filesystem Read_from_Head ${READ_FROM_HEAD} ... [FILTER] Name kubernetes Match application.* Kube_URL https://kubernetes.default.svc:443 Kube_Tag_Prefix application.var.log.containers. Merge_Log On Merge_Log_Key log_processed K8S-Logging.Parser On K8S-Logging.Exclude Off Labels Off Annotations Off Use_Kubelet On Kubelet_Port 10250 Buffer_Size 0 [OUTPUT] Name cloudwatch_logs Match application.* region ${AWS_REGION} log_group_name /aws/containerinsights/${CLUSTER_NAME}/application log_stream_prefix ${HOST_NAME}- auto_create_group true extra_user_agent container-insights ... # Fluent Bit 파드가 수집하는 방법 : Volumes에 HostPath를 살펴보자! kubectl describe -n amazon-cloudwatch ds fluent-bit ... ssh ec2-user@$N1 sudo tree /var/log ssh ec2-user@$N2 sudo tree /var/log ssh ec2-user@$N3 sudo tree /var/log 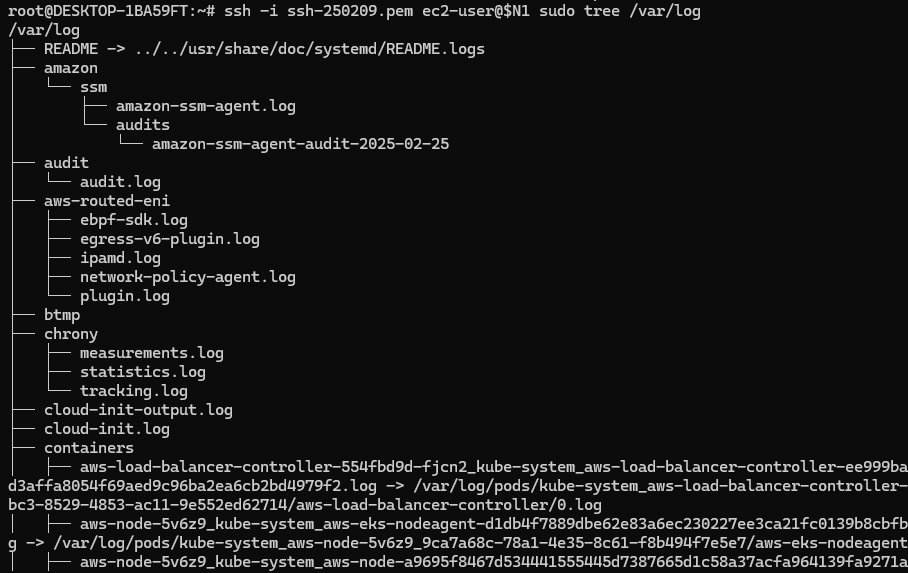 |
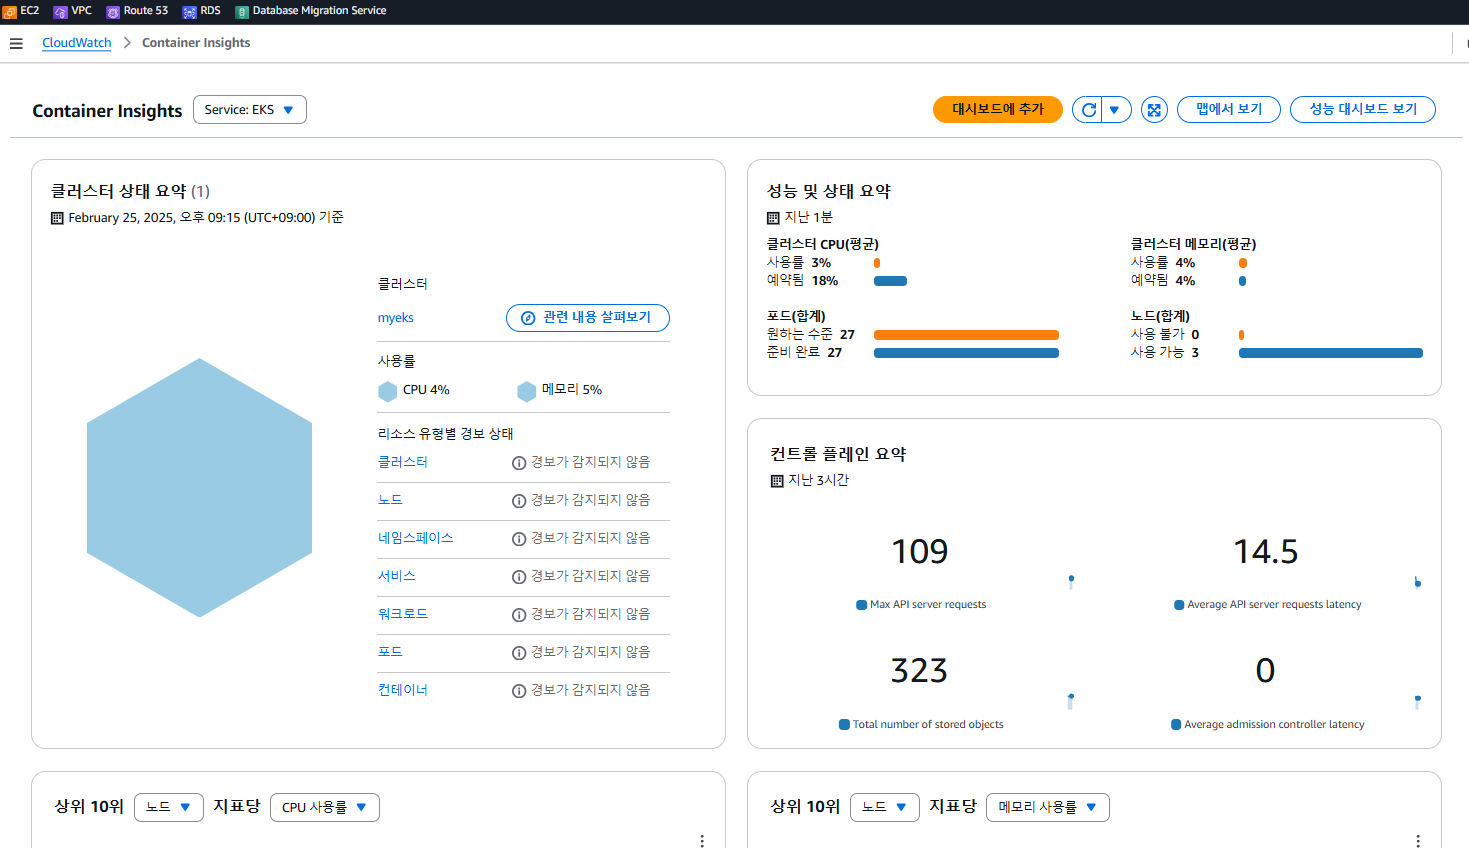
메트릭 확인 : CW → 인사이트 → Container Insights
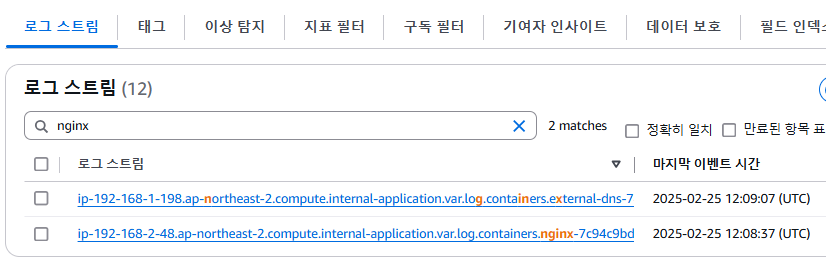
로그 그룹 - Link → application → 로그 스트림 : nginx 필터링 ⇒ 클릭 후 확인 ⇒ ApacheBench 필터링 확인
| # Application log errors by container name : 컨테이너 이름별 애플리케이션 로그 오류 # 로그 그룹 선택 : /aws/containerinsights/<CLUSTER_NAME>/application stats count() as error_count by kubernetes.container_name | filter stream="stderr" | sort error_count desc # All Kubelet errors/warning logs for for a given EKS worker node # 로그 그룹 선택 : /aws/containerinsights/<CLUSTER_NAME>/dataplane fields @timestamp, @message, ec2_instance_id | filter message =~ /.*(E|W)[0-9]{4}.*/ and ec2_instance_id="<YOUR INSTANCE ID>" | sort @timestamp desc # Kubelet errors/warning count per EKS worker node in the cluster # 로그 그룹 선택 : /aws/containerinsights/<CLUSTER_NAME>/dataplane fields @timestamp, @message, ec2_instance_id | filter message =~ /.*(E|W)[0-9]{4}.*/ | stats count(*) as error_count by ec2_instance_id # performance 로그 그룹 # 로그 그룹 선택 : /aws/containerinsights/<CLUSTER_NAME>/performance # 노드별 평균 CPU 사용률 STATS avg(node_cpu_utilization) as avg_node_cpu_utilization by NodeName | SORT avg_node_cpu_utilization DESC # 파드별 재시작(restart) 카운트 STATS avg(number_of_container_restarts) as avg_number_of_container_restarts by PodName | SORT avg_number_of_container_restarts DESC # 요청된 Pod와 실행 중인 Pod 간 비교 fields @timestamp, @message | sort @timestamp desc | filter Type="Pod" | stats min(pod_number_of_containers) as requested, min(pod_number_of_running_containers) as running, ceil(avg(pod_number_of_containers-pod_number_of_running_containers)) as pods_missing by kubernetes.pod_name | sort pods_missing desc # 클러스터 노드 실패 횟수 stats avg(cluster_failed_node_count) as CountOfNodeFailures | filter Type="Cluster" | sort @timestamp desc # 파드별 CPU 사용량 stats pct(container_cpu_usage_total, 50) as CPUPercMedian by kubernetes.container_name | filter Type="Container" | sort CPUPercMedian desc 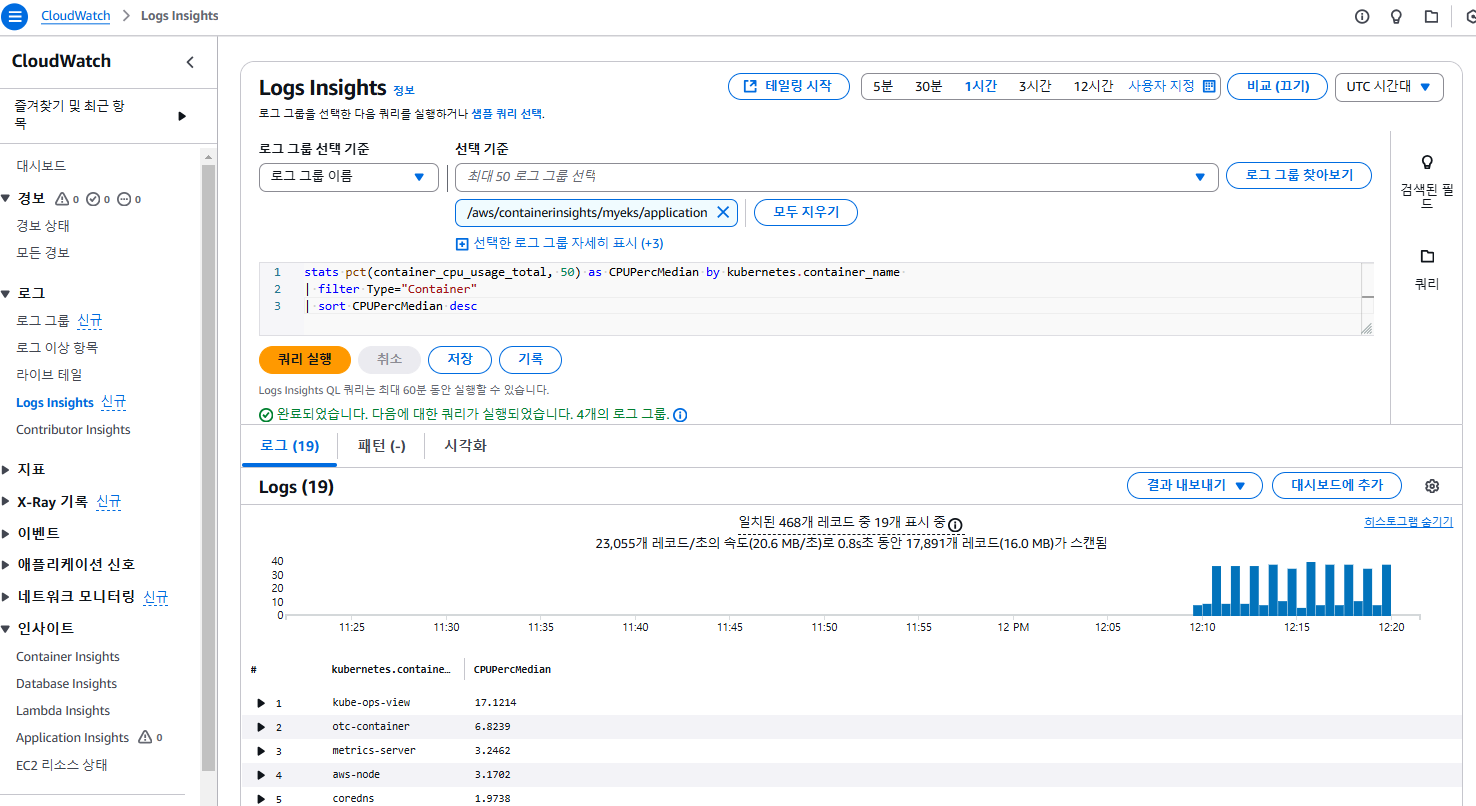 |
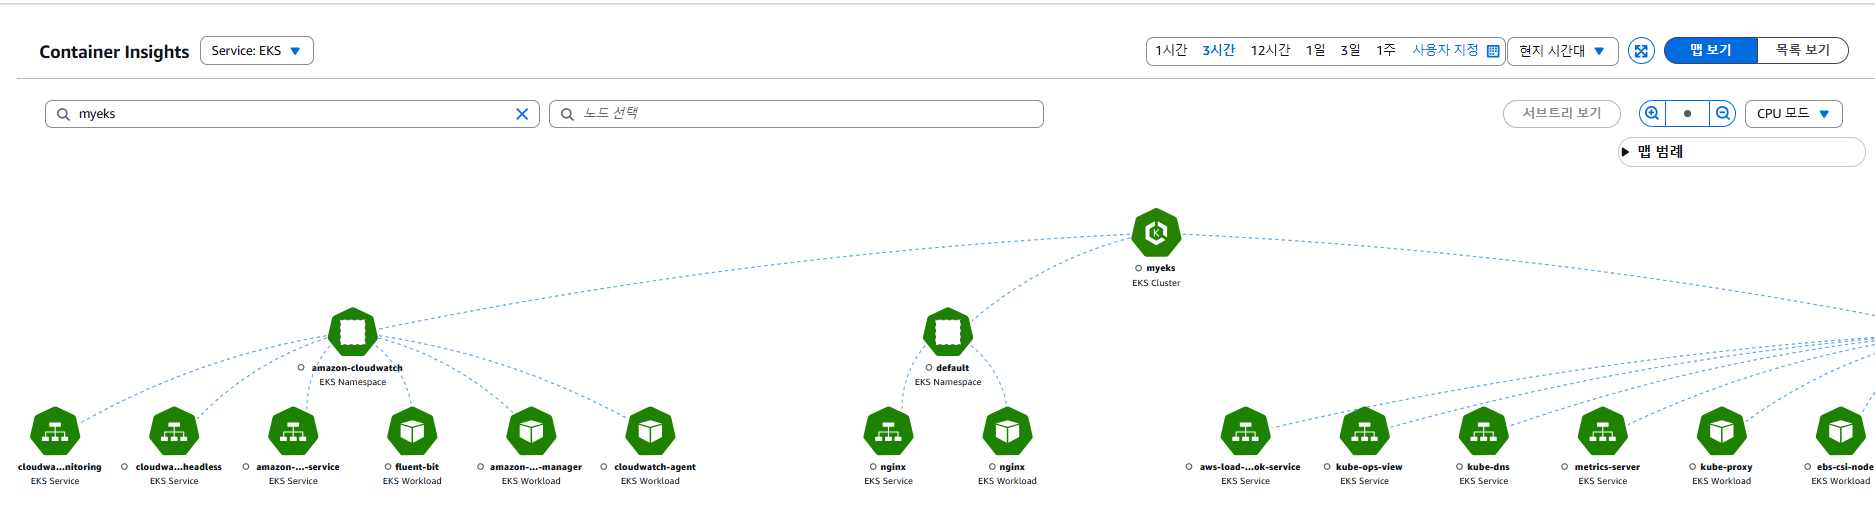
Metrics-server 확인 : kubelet으로부터 수집한 리소스 메트릭을 수집 및 집계하는 클러스터 애드온 구성 요소
| # 메트릭 서버 확인 : 메트릭은 15초 간격으로 cAdvisor를 통하여 가져옴 kubectl get pod -n kube-system -l app.kubernetes.io/name=metrics-server kubectl api-resources | grep metrics kubectl get apiservices |egrep '(AVAILABLE|metrics)' # 노드 메트릭 확인 kubectl top node # 파드 메트릭 확인 kubectl top pod -A kubectl top pod -n kube-system --sort-by='cpu' kubectl top pod -n kube-system --sort-by='memory' 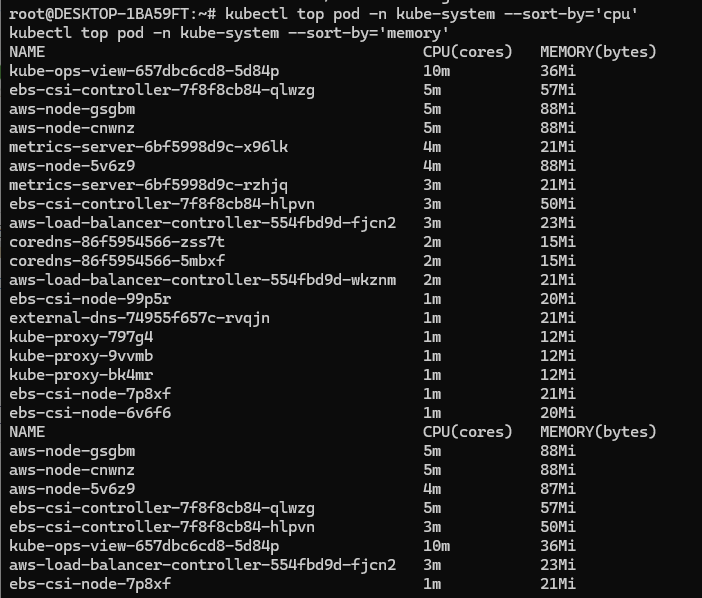 |
5. 프로메테우스-스택
[운영서버 EC2] 프로메테우스 직접 설치
| # 최신 버전 다운로드 wget https://github.com/prometheus/prometheus/releases/download/v3.2.0/prometheus-3.2.0.linux-amd64.tar.gz # 압축 해제 tar -xvf prometheus-3.2.0.linux-amd64.tar.gz cd prometheus-3.2.0.linux-amd64 ls -l # mv prometheus /usr/local/bin/ mv promtool /usr/local/bin/ mkdir -p /etc/prometheus /var/lib/prometheus mv prometheus.yml /etc/prometheus/ cat /etc/prometheus/prometheus.yml # useradd --no-create-home --shell /sbin/nologin prometheus chown -R prometheus:prometheus /etc/prometheus /var/lib/prometheus chown prometheus:prometheus /usr/local/bin/prometheus /usr/local/bin/promtool # tee /etc/systemd/system/prometheus.service > /dev/null << EOF [Unit] Description=Prometheus Wants=network-online.target After=network-online.target [Service] User=prometheus Group=prometheus Type=simple ExecStart=/usr/local/bin/prometheus \ --config.file=/etc/prometheus/prometheus.yml \ --storage.tsdb.path=/var/lib/prometheus \ --web.listen-address=0.0.0.0:9090 [Install] WantedBy=multi-user.target EOF # systemctl daemon-reload systemctl enable --now prometheus systemctl status prometheus ss -tnlp # curl localhost:9090/metrics echo -e "http://$(curl -s ipinfo.io/ip):9090" # Node Exporter 최신 버전 다운로드 cd ~ wget https://github.com/prometheus/node_exporter/releases/download/v1.9.0/node_exporter-1.9.0.linux-amd64.tar.gz tar xvfz node_exporter-1.9.0.linux-amd64.tar.gz cd node_exporter-1.9.0.linux-amd64 cp node_exporter /usr/local/bin/ # groupadd -f node_exporter useradd -g node_exporter --no-create-home --shell /sbin/nologin node_exporter chown node_exporter:node_exporter /usr/local/bin/node_exporter # tee /etc/systemd/system/node_exporter.service > /dev/null <<EOF [Unit] Description=Node Exporter Documentation=https://prometheus.io/docs/guides/node-exporter/ Wants=network-online.target After=network-online.target [Service] User=node_exporter Group=node_exporter Type=simple Restart=on-failure ExecStart=/usr/local/bin/node_exporter \ --web.listen-address=:9200 [Install] WantedBy=multi-user.target EOF # 데몬 실행 systemctl daemon-reload systemctl enable --now node_exporter systemctl status node_exporter ss -tnlp # curl localhost:9200/metrics # prometheus.yml 수정 cat << EOF >> /etc/prometheus/prometheus.yml - job_name: 'node_exporter' static_configs: - targets: ["127.0.0.1:9200"] labels: alias: 'myec2' EOF # prometheus 데몬 재기동 systemctl restart prometheus.service systemctl status prometheus prometheus 웹에서 target 확인 및 node 로 시작되는 메트릭 쿼리 해보기 rate(node_cpu_seconds_total{mode="system"}[1m]) node_filesystem_avail_bytes rate(node_network_receive_bytes_total[1m]) |

프로메테우스-스택 설치 : 모니터링에 필요한 여러 요소를 단일 차트(스택)으로 제공 (각 노드)
| # 모니터링 watch kubectl get pod,pvc,svc,ingress -n monitoring # repo 추가 helm repo add prometheus-community https://prometheus-community.github.io/helm-charts # 파라미터 파일 생성 cat <<EOT > monitor-values.yaml prometheus: prometheusSpec: scrapeInterval: "15s" evaluationInterval: "15s" podMonitorSelectorNilUsesHelmValues: false serviceMonitorSelectorNilUsesHelmValues: false retention: 5d retentionSize: "10GiB" storageSpec: volumeClaimTemplate: spec: storageClassName: gp3 accessModes: ["ReadWriteOnce"] resources: requests: storage: 30Gi ingress: enabled: true ingressClassName: alb hosts: - prometheus.$MyDomain paths: - /* annotations: alb.ingress.kubernetes.io/scheme: internet-facing alb.ingress.kubernetes.io/target-type: ip alb.ingress.kubernetes.io/listen-ports: '[{"HTTPS":443}, {"HTTP":80}]' alb.ingress.kubernetes.io/certificate-arn: $CERT_ARN alb.ingress.kubernetes.io/success-codes: 200-399 alb.ingress.kubernetes.io/load-balancer-name: myeks-ingress-alb alb.ingress.kubernetes.io/group.name: study alb.ingress.kubernetes.io/ssl-redirect: '443' grafana: defaultDashboardsTimezone: Asia/Seoul adminPassword: prom-operator ingress: enabled: true ingressClassName: alb hosts: - grafana.$MyDomain paths: - /* annotations: alb.ingress.kubernetes.io/scheme: internet-facing alb.ingress.kubernetes.io/target-type: ip alb.ingress.kubernetes.io/listen-ports: '[{"HTTPS":443}, {"HTTP":80}]' alb.ingress.kubernetes.io/certificate-arn: $CERT_ARN alb.ingress.kubernetes.io/success-codes: 200-399 alb.ingress.kubernetes.io/load-balancer-name: myeks-ingress-alb alb.ingress.kubernetes.io/group.name: study alb.ingress.kubernetes.io/ssl-redirect: '443' persistence: enabled: true type: sts storageClassName: "gp3" accessModes: - ReadWriteOnce size: 20Gi alertmanager: enabled: false defaultRules: create: false kubeControllerManager: enabled: false kubeEtcd: enabled: false kubeScheduler: enabled: false prometheus-windows-exporter: prometheus: monitor: enabled: false EOT cat monitor-values.yaml # 배포 helm install kube-prometheus-stack prometheus-community/kube-prometheus-stack --version 69.3.1 -f monitor-values.yaml --create-namespace --namespace monitoring # 확인 helm list -n monitoring kubectl get sts,ds,deploy,pod,svc,ep,ingress,pvc,pv -n monitoring kubectl get-all -n monitoring kubectl get prometheus,servicemonitors -n monitoring kubectl get crd | grep monitoring kubectl df-pv # 프로메테우스 버전 확인 echo -e "https://prometheus.$MyDomain/api/v1/status/buildinfo" open https://prometheus.$MyDomain/api/v1/status/buildinfo # macOS kubectl exec -it sts/prometheus-kube-prometheus-stack-prometheus -n monitoring -c prometheus -- prometheus --version prometheus, version 3.1.0 (branch: HEAD, revision: 7086161a93b262aa0949dbf2aba15a5a7b13e0a3) ... # 프로메테우스 웹 접속 echo -e "https://prometheus.$MyDomain" # 그라파나 웹 접속 echo -e "https://grafana.$MyDomain" |
| alertmanager-0 | 사전에 정의한 정책 기반(예: 노드 다운, 파드 Pending 등)으로 시스템 경고 메시지를 생성 후 경보 채널(슬랙 등)로 전송 |
| grafana-0 | 프로메테우스는 메트릭 정보를 저장하는 용도로 사용하며, 그라파나로 시각화 처리 |
| prometheus-0 | 모니터링 대상이 되는 파드는 ‘exporter’라는 별도의 사이드카 형식의 파드에서 모니터링 메트릭을 노출, pull 방식으로 가져와 내부의 시계열 데이터베이스에 저장 |
| node-exporter | 노드익스포터는 물리 노드에 대한 자원 사용량(네트워크, 스토리지 등 전체) 정보를 메트릭 형태로 변경하여 노출 |
| operator | 시스템 경고 메시지 정책(prometheus rule), 애플리케이션 모니터링 대상 추가 등의 작업을 편리하게 할 수 있게 CRD 지원 |
| kube-state-metrics | 쿠버네티스의 클러스터의 상태(kube-state)를 메트릭으로 변환하는 파드 |
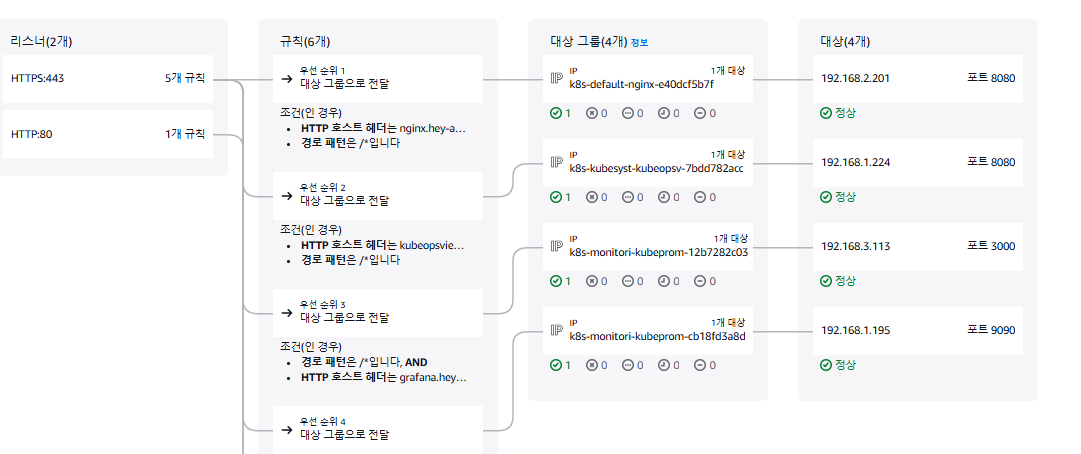
# PodMonitor 배포
| cat <<EOF | kubectl create -f - apiVersion: monitoring.coreos.com/v1 kind: PodMonitor metadata: name: aws-cni-metrics namespace: kube-system spec: jobLabel: k8s-app namespaceSelector: matchNames: - kube-system podMetricsEndpoints: - interval: 30s path: /metrics port: metrics selector: matchLabels: k8s-app: aws-node EOF |
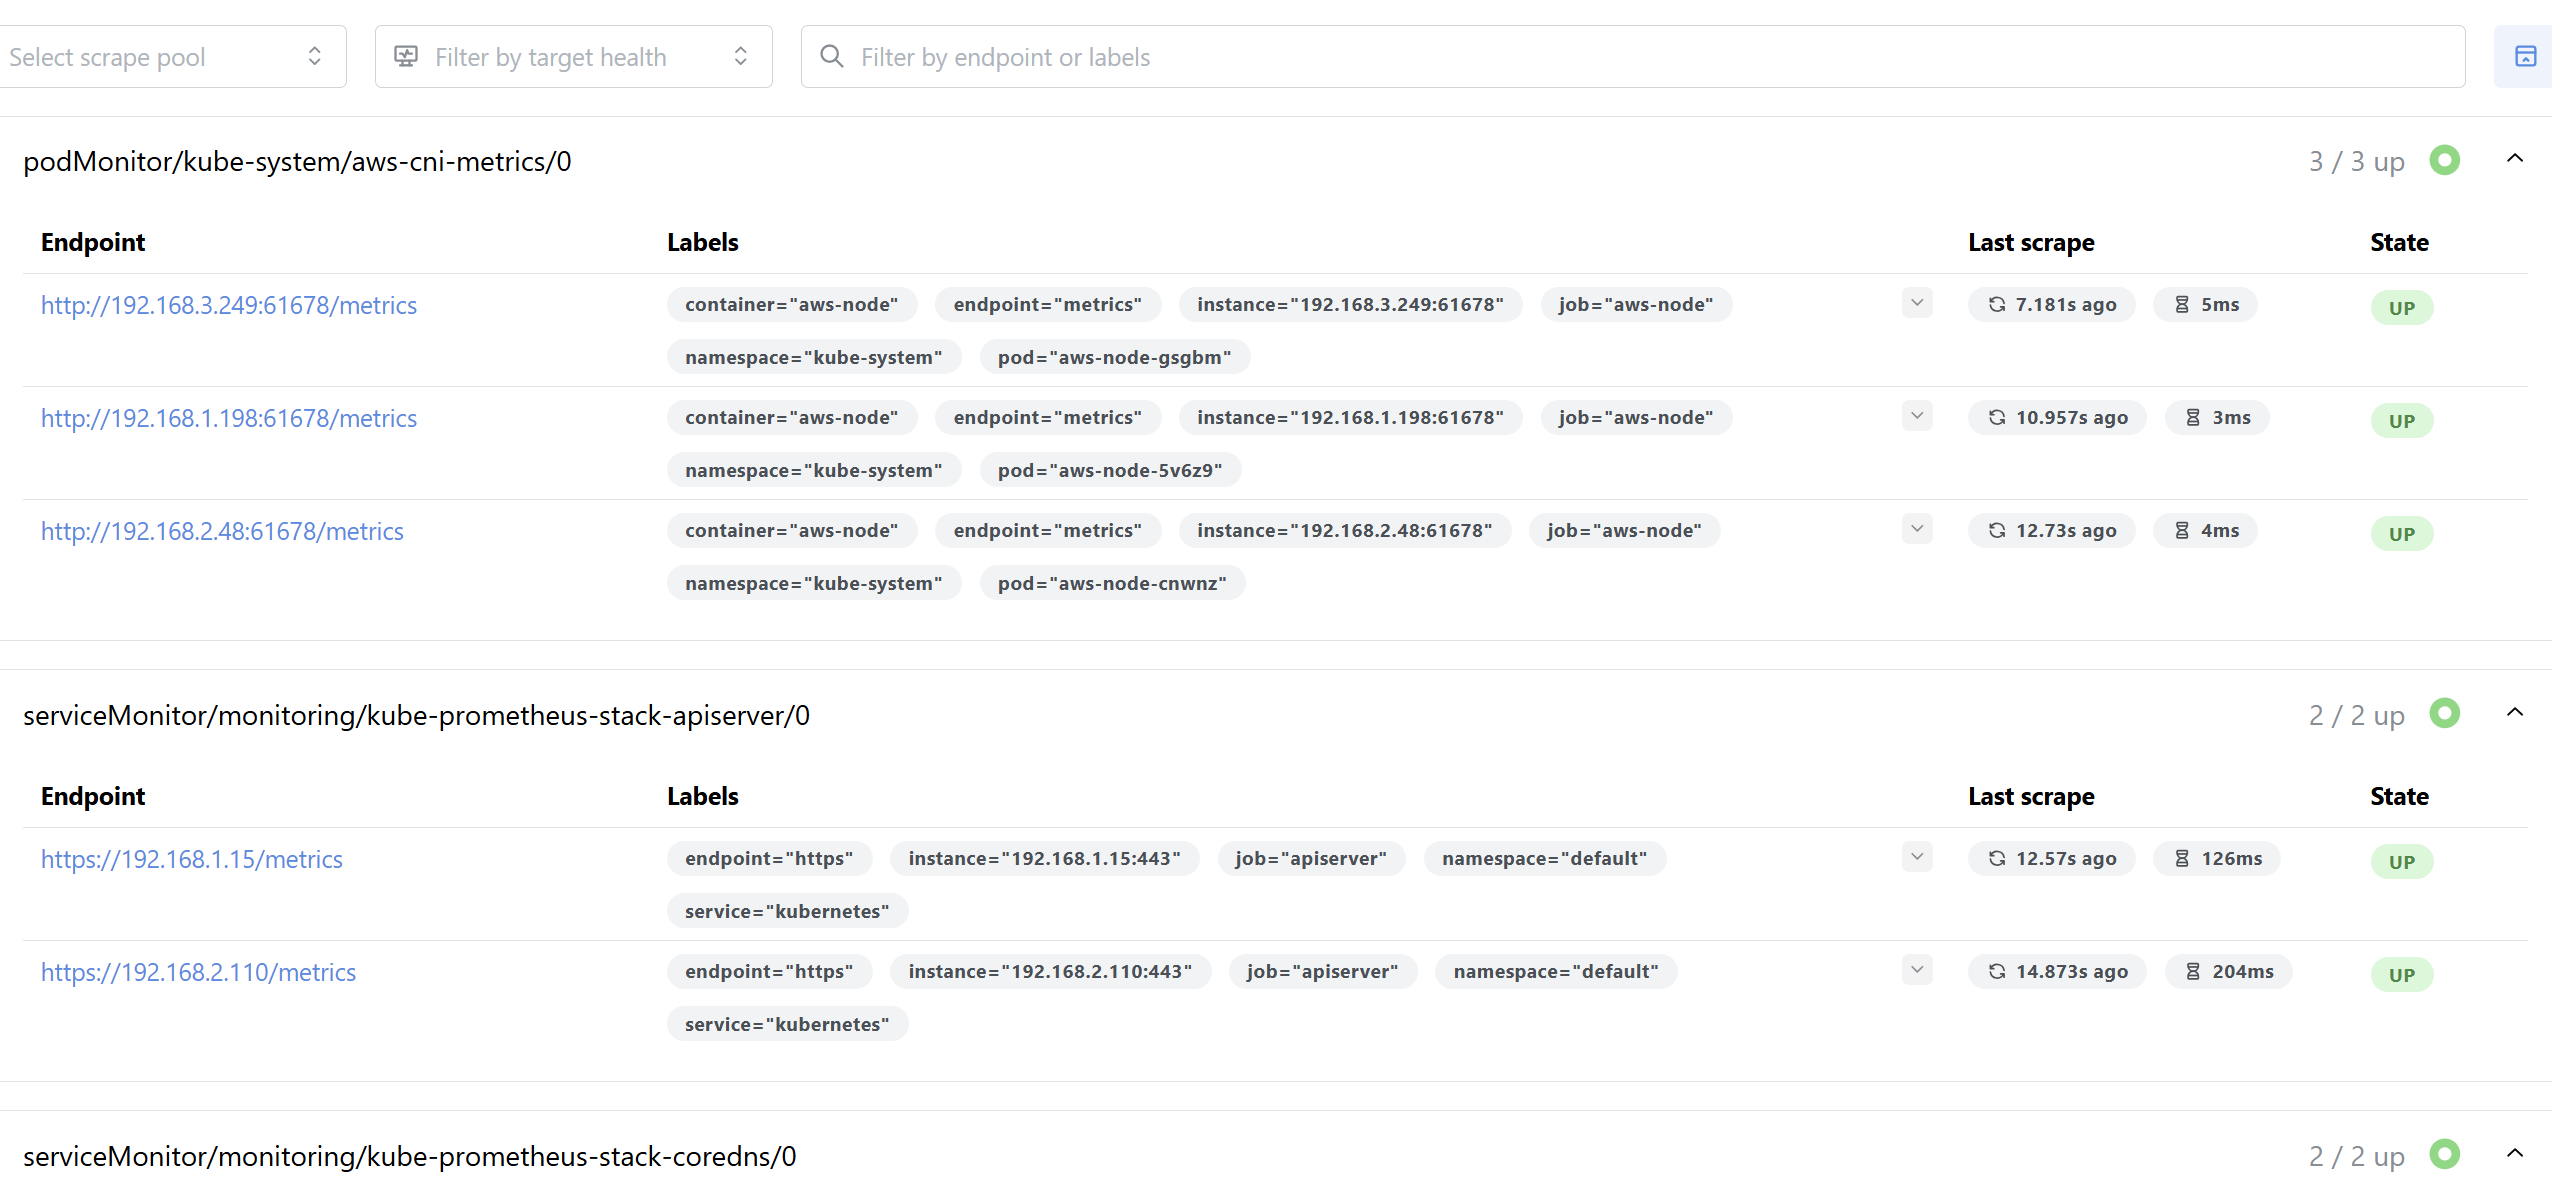
| # 웹 상단 주요 메뉴 설명 1. 쿼리(Query) : 프로메테우스 자체 검색 언어 PromQL을 이용하여 메트릭 정보를 조회 -> 단순한 그래프 형태 조회 2. 경고(Alerts) : 사전에 정의한 시스템 경고 정책(Prometheus Rules)에 대한 상황 3. 상태(Status) : 경고 메시지 정책(Rules), 모니터링 대상(Targets) 등 다양한 프로메테우스 설정 내역을 확인 > 버전 정보 |
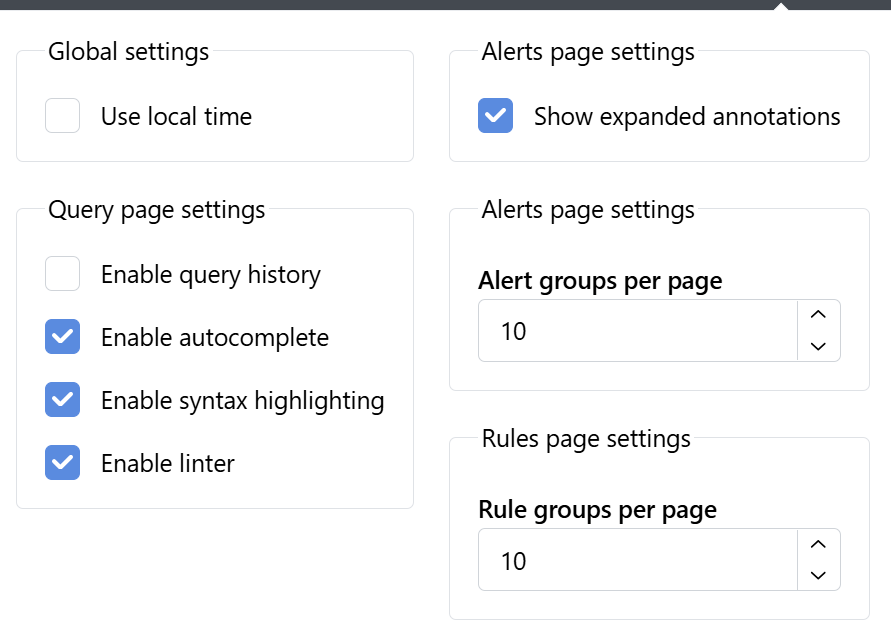
- Use local time : 출력 시간을 로컬 타임으로 변경
- Enable query history : PromQL 쿼리 히스토리 활성화
- Enable autocomplete : 자동 완성 기능 활성화
- Enable highlighting : 하이라이팅 기능 활성화
- Enable linter : 문법 오류 감지, 자동 코스 스타일 체크
- Statues → 프로메테우스 설정(Configuration) 확인 : Status → Runtime & Build Information 클릭
- Storage retention : 5d or 10GiB → 메트릭 저장 기간이 5일 경과 혹은 10GiB 이상 시 오래된 것부터 삭제 ⇒ helm 파라미터에서 수정 가능
- Statues → 프로메테우스 설정(Configuration) 확인 : Status → Command-Line Flags 클릭
- -log.level : info
- -storage.tsdb.retention.size : 10GiB
- -storage.tsdb.retention.time : 5d
- Statues → 프로메테우스 설정(Configuration) 확인 : Status → Configuration
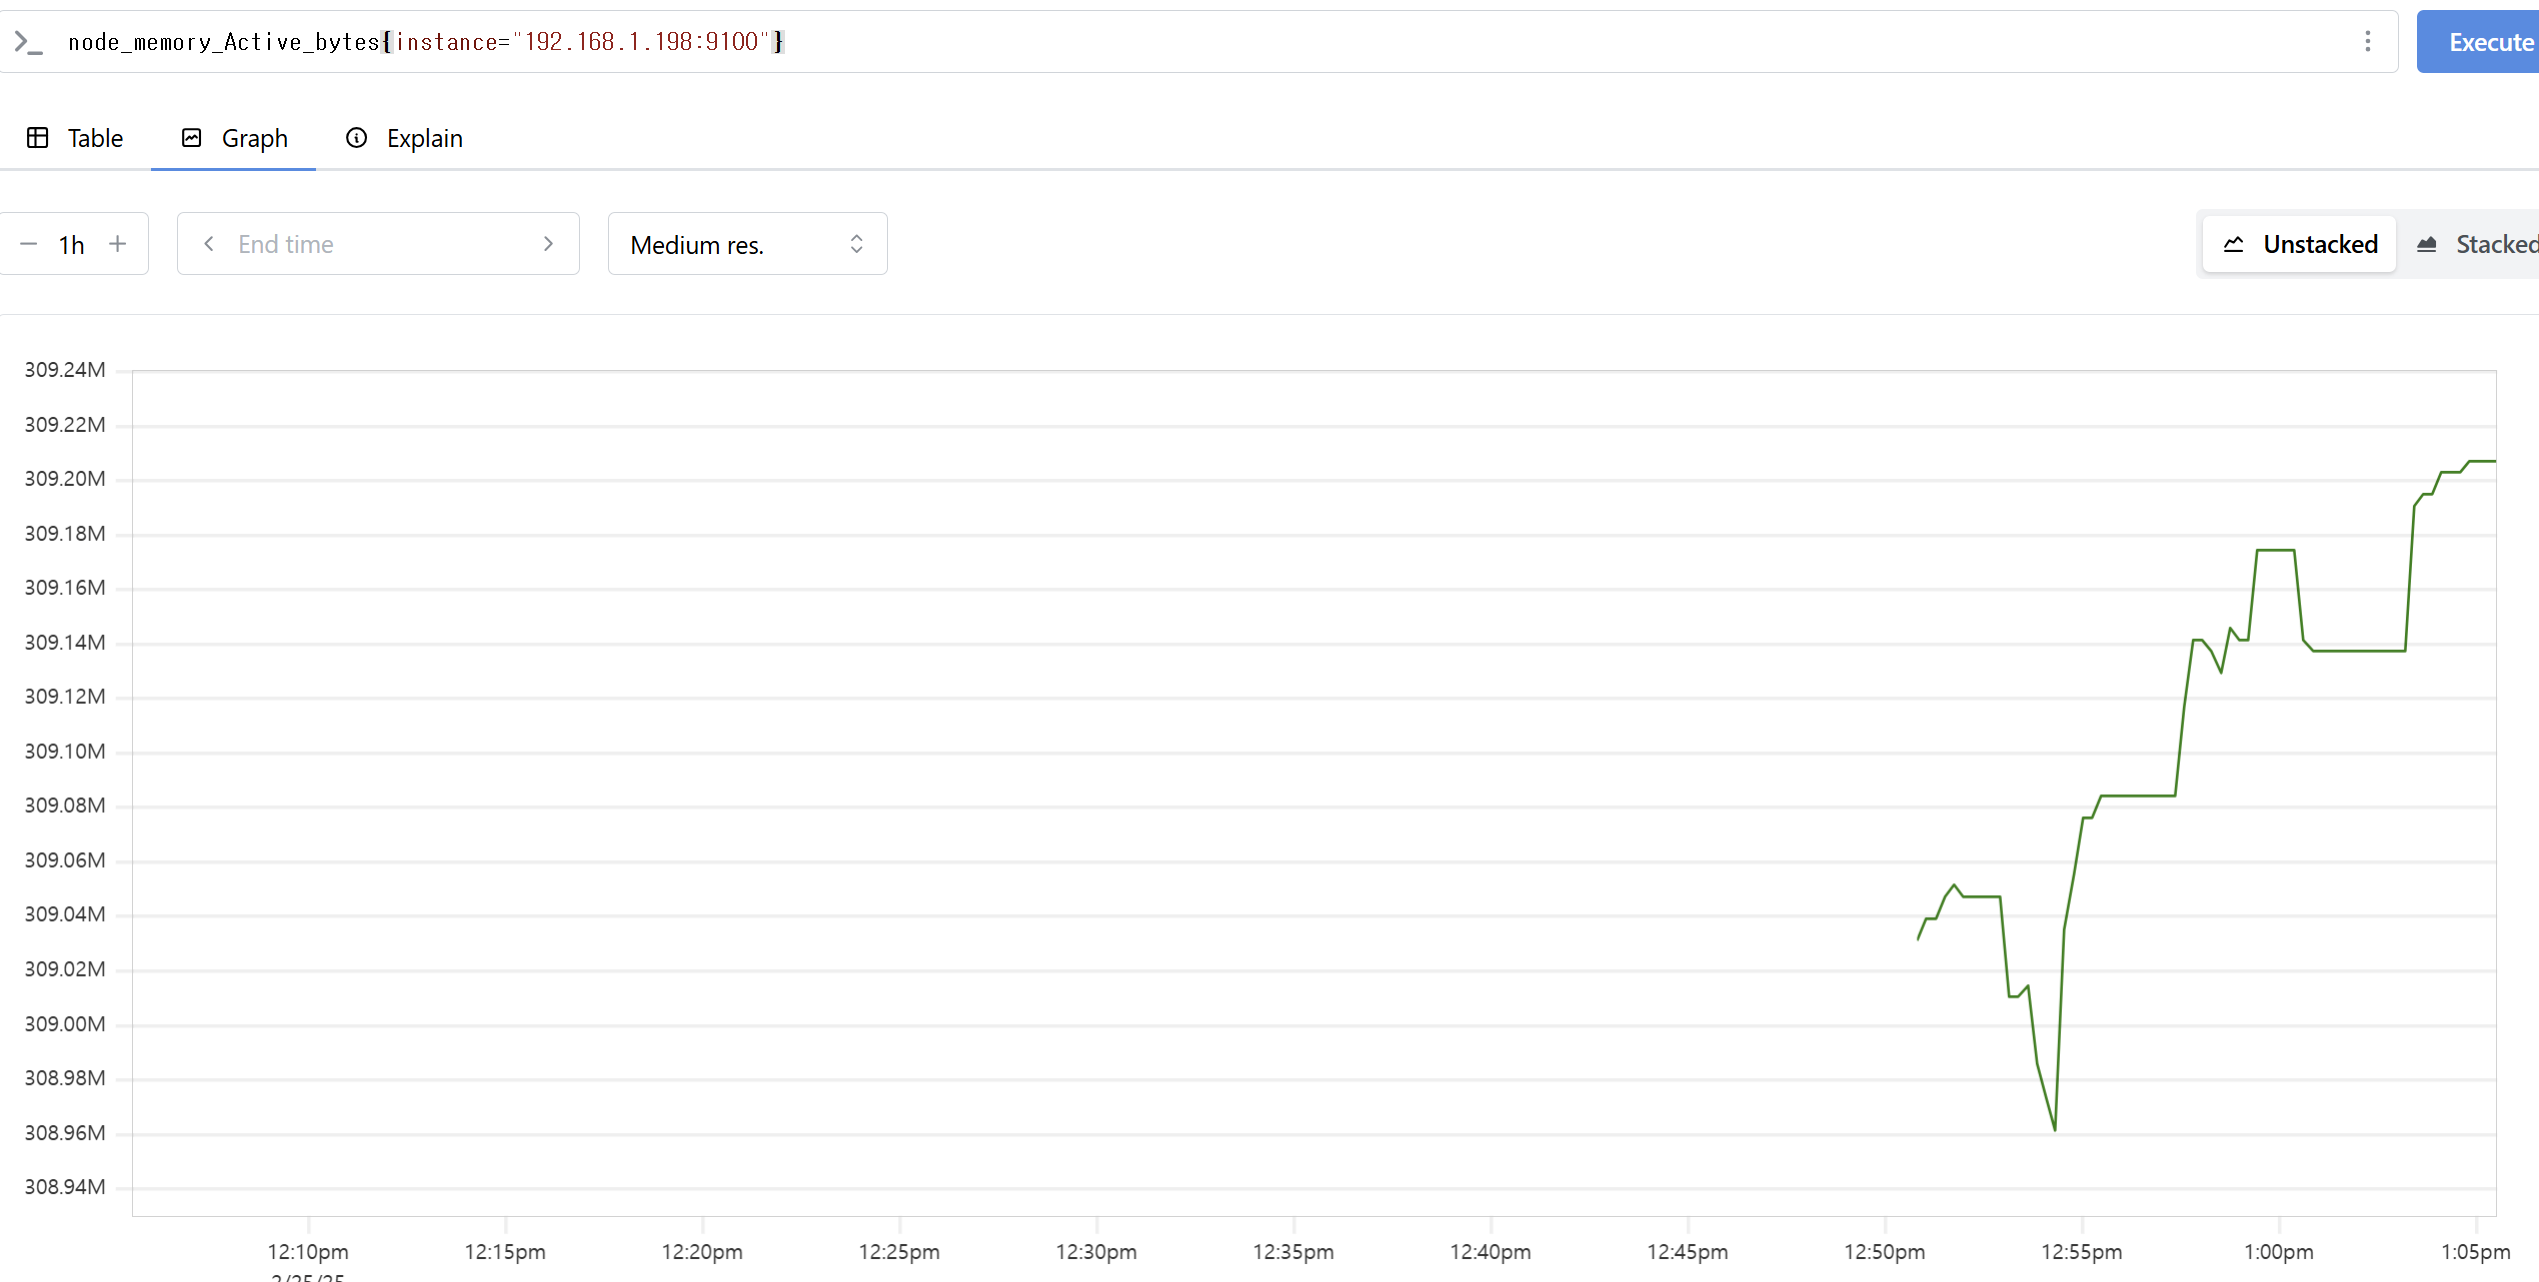
| # Table 아래 쿼리 입력 후 Execute 클릭 -> Graph 확인 ## 출력되는 메트릭 정보는 node-exporter 를 통해서 노드에서 수집된 정보 node_memory_Active_bytes # 특정 노드(인스턴스) 필터링 : 아래 IP는 출력되는 자신의 인스턴스 PrivateIP 입력 후 Execute 클릭 -> Graph 확인 node_memory_Active_bytes{instance="192.168.1.198:9100"} |
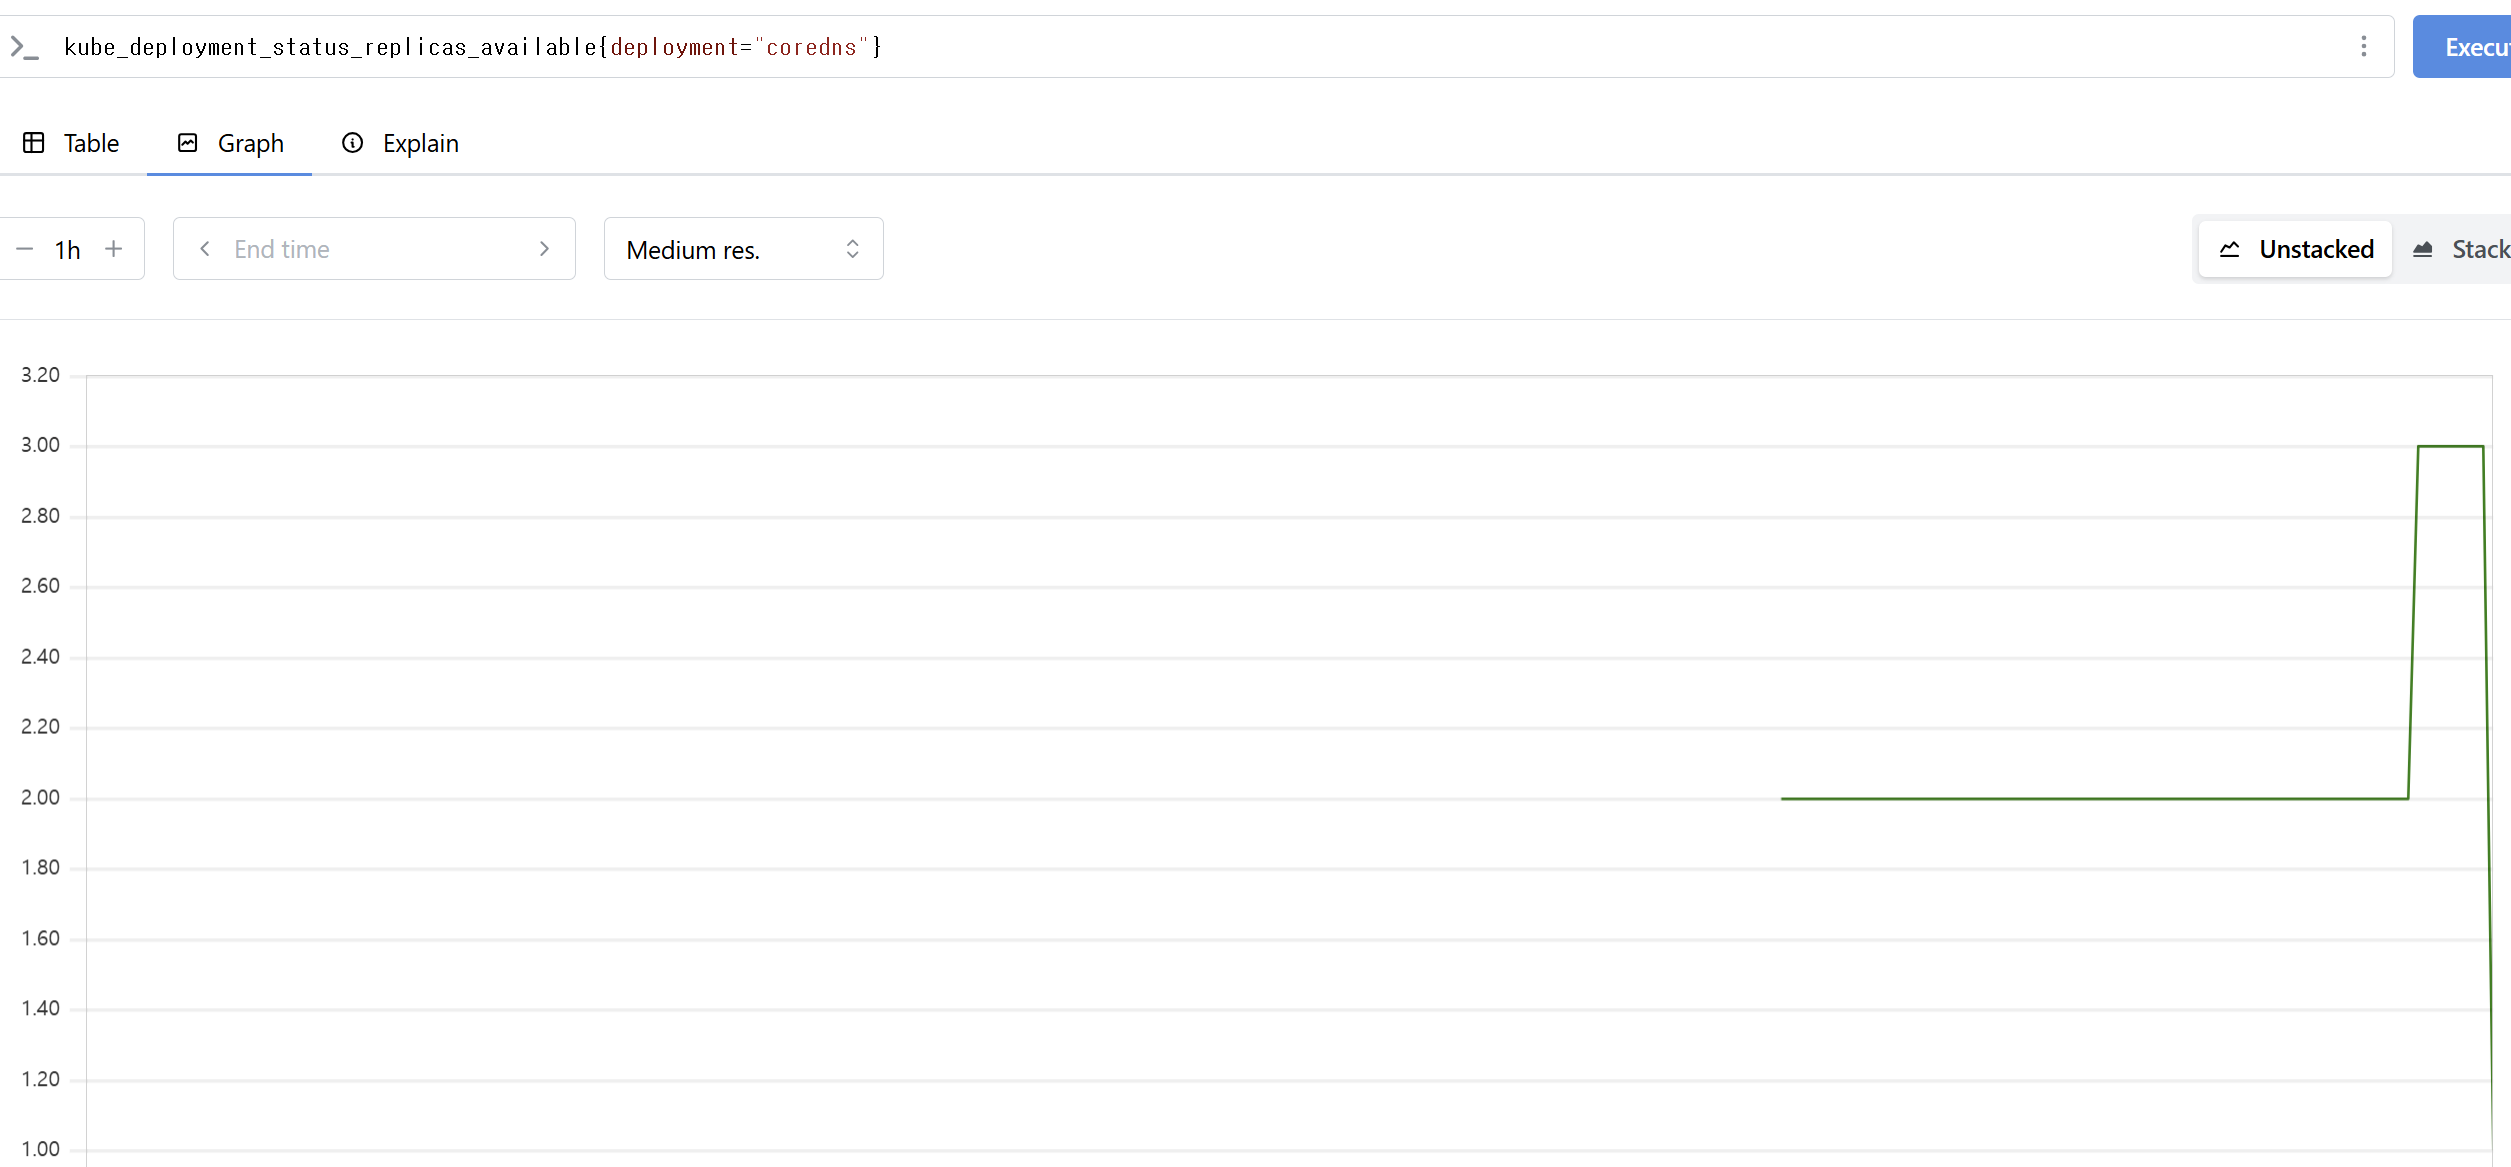
| # replicas's number kube_deployment_status_replicas kube_deployment_status_replicas_available kube_deployment_status_replicas_available{deployment="coredns"} # scale out kubectl scale deployment -n kube-system coredns --replicas 3 # 확인 kube_deployment_status_replicas_available{deployment="coredns"} # scale in kubectl scale deployment -n kube-system coredns --replicas 1 # kubeproxy_sync_proxy_rules_iptables_total kubeproxy_sync_proxy_rules_iptables_total{table="filter"} kubeproxy_sync_proxy_rules_iptables_total{table="nat"} kubeproxy_sync_proxy_rules_iptables_total{table="nat", instance="192.168.1.188:10249"} # kubeproxy_sync_proxy_rules_iptables_total kubeproxy_sync_proxy_rules_iptables_total{table="filter"} kubeproxy_sync_proxy_rules_iptables_total{table="nat"} kubeproxy_sync_proxy_rules_iptables_total{table="nat", instance="192.168.1.188:10249"} |
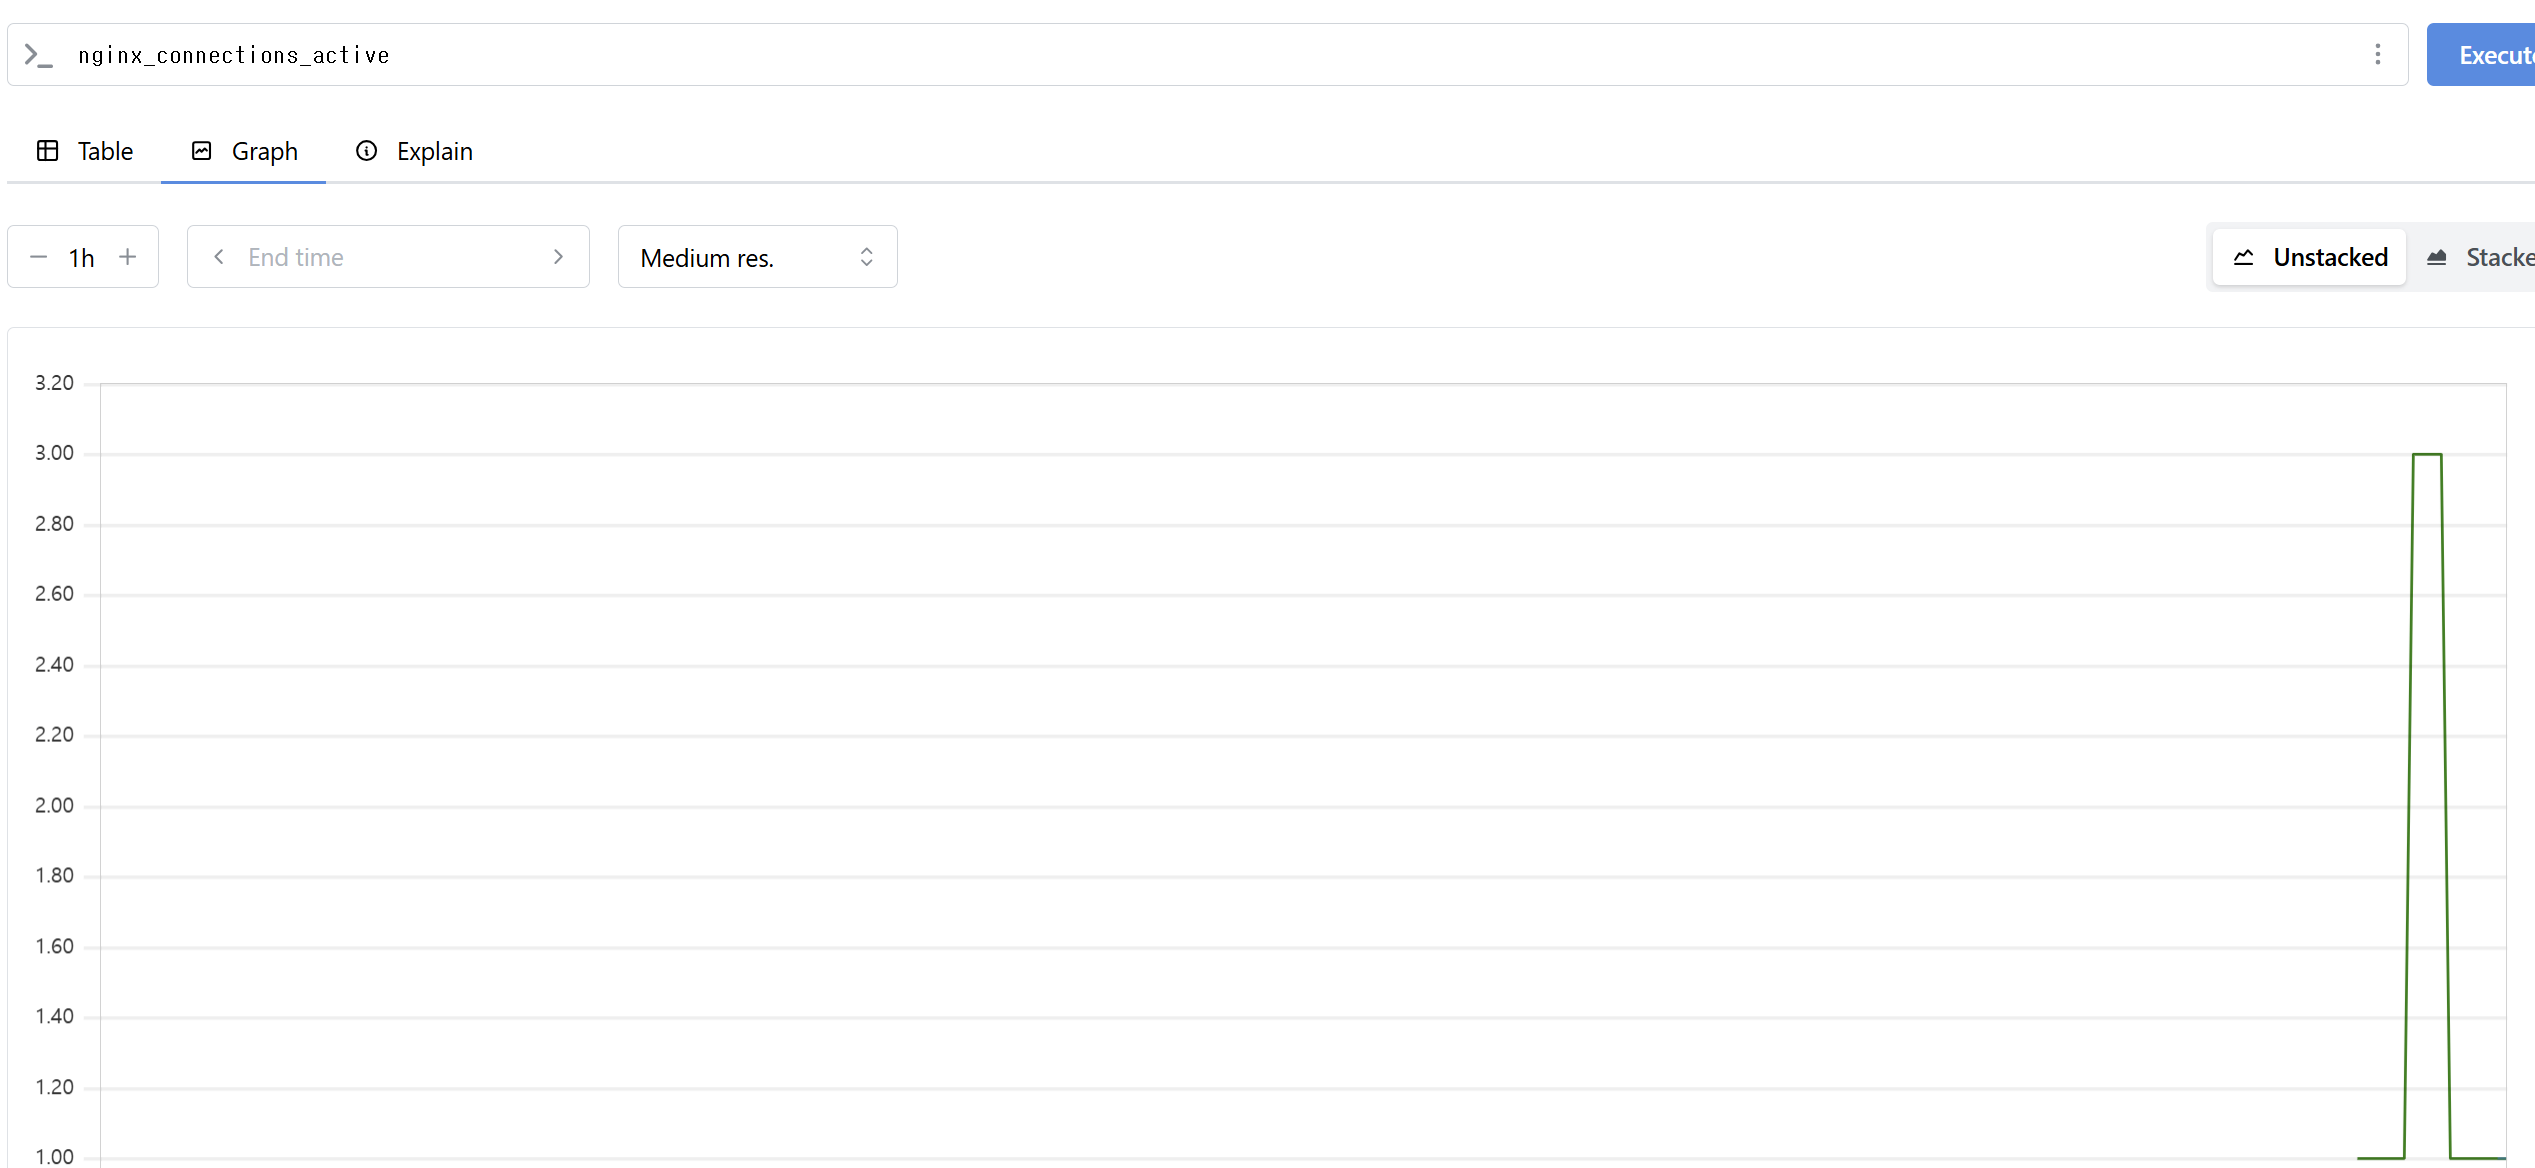
| # 접속 주소 확인 및 접속 echo -e "Nginx WebServer URL = https://nginx.$MyDomain" curl -s https://nginx.$MyDomain kubectl stern deploy/nginx # 반복 접속 while true; do curl -s https://nginx.$MyDomain -I | head -n 1; date; sleep 1; done # 그라파나 query 확인 nginx_up sum(nginx_up) nginx_http_requests_total nginx_connections_active |

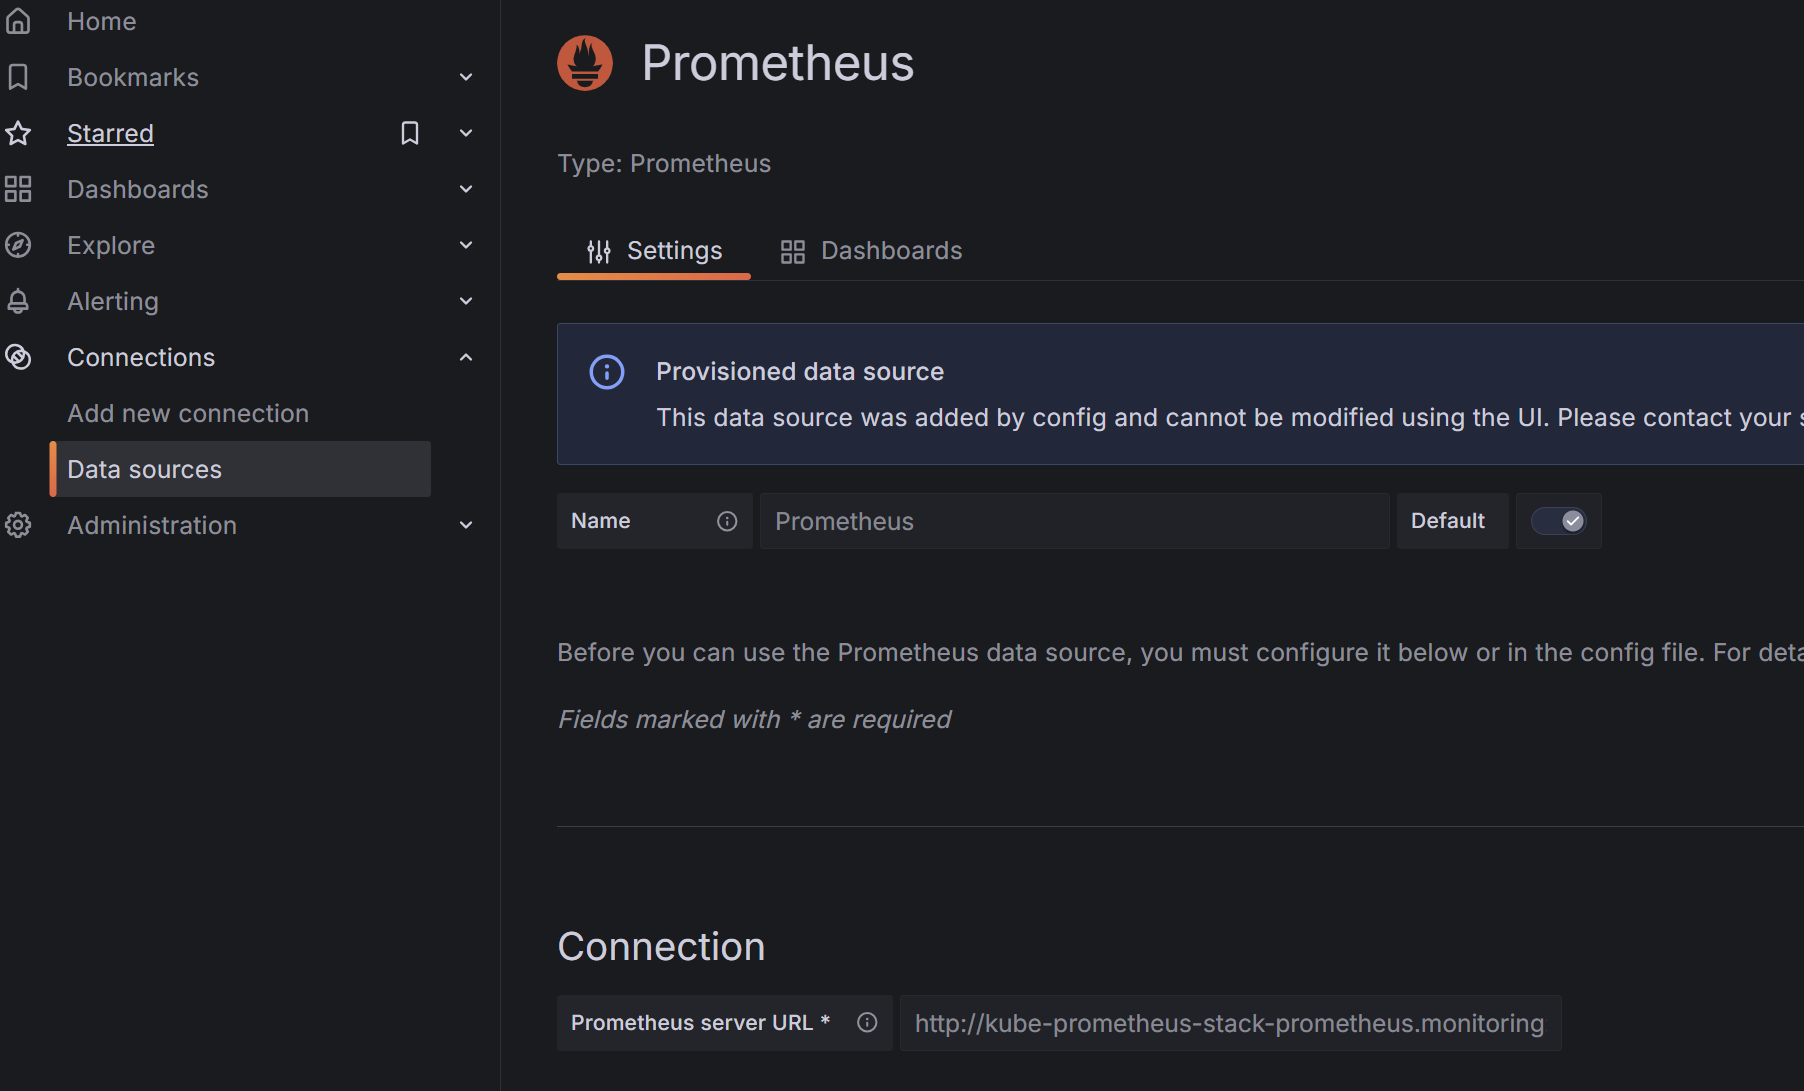
6. 그라파나 Grafana
echo -e "Grafana Web URL = https://grafana.$MyDomain"
공식 대시보드 가져오기
- [Kubernetes / Views / Global] Dashboard → New → Import → 15757 력입력 후 Load ⇒ 데이터소스(Prometheus 선택) 후 Import 클릭
- [1 Kubernetes All-in-one Cluster Monitoring KR] Dashboard → New → Import → 17900 입력 후 Load ⇒ 데이터소스(Prometheus 선택) 후 Import 클릭
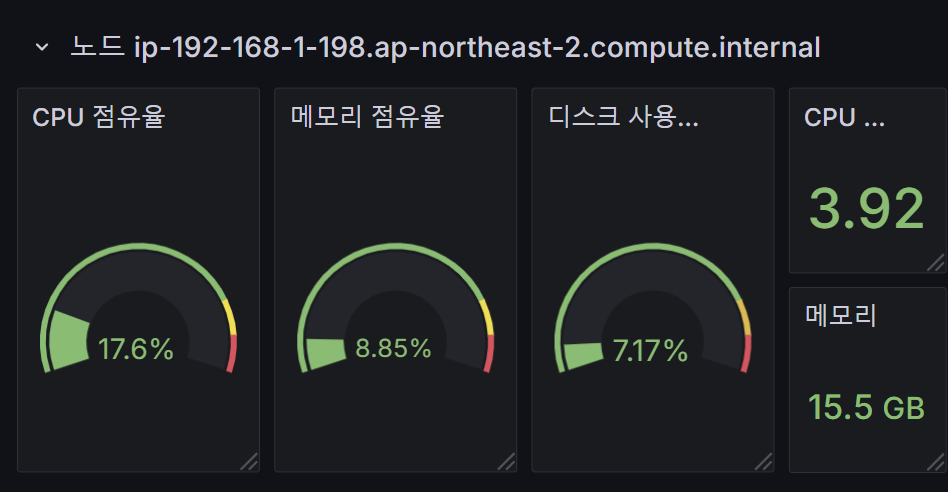
| 그라파나 query 에서 확인 후 node_cpu_seconds_total node_cpu_seconds_total{mode!~"guest.*|idle|iowait"} avg(node_cpu_seconds_total{mode!~"guest.*|idle|iowait"}) by (node) avg(node_cpu_seconds_total{mode!~"guest.*|idle|iowait"}) by (instance) 변경해준다. sum by (instance) (irate(node_cpu_seconds_total{mode!~"guest.*|idle|iowait", instance="$instance"}[5m])) # 수정 : 메모리 점유율 (node_memory_MemTotal_bytes{instance="$instance"}-node_memory_MemAvailable_bytes{instance="$instance"})/node_memory_MemTotal_bytes{instance="$instance"} # 수정 : 디스크 사용률 sum(node_filesystem_size_bytes{instance="$instance"} - node_filesystem_avail_bytes{instance="$instance"}) by (instance) / sum(node_filesystem_size_bytes{instance="$instance"}) by (instance) |

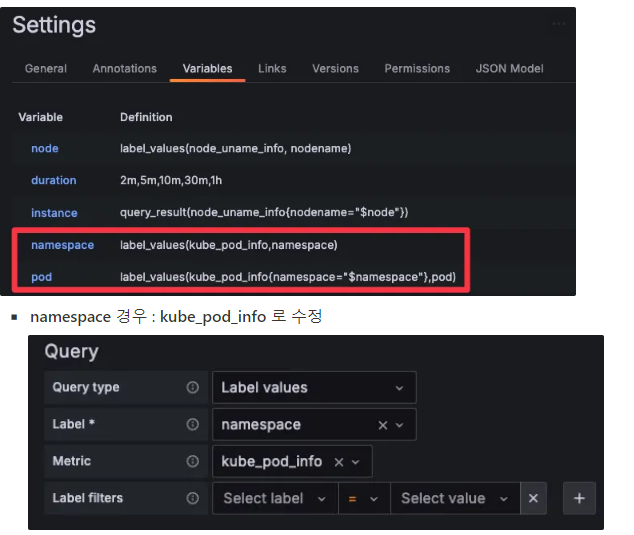
오른쪽 상단 Edit → Settings → Variables 아래 namesapce, pod 값 수정 ⇒ 수정 후 Save dashboard 클릭
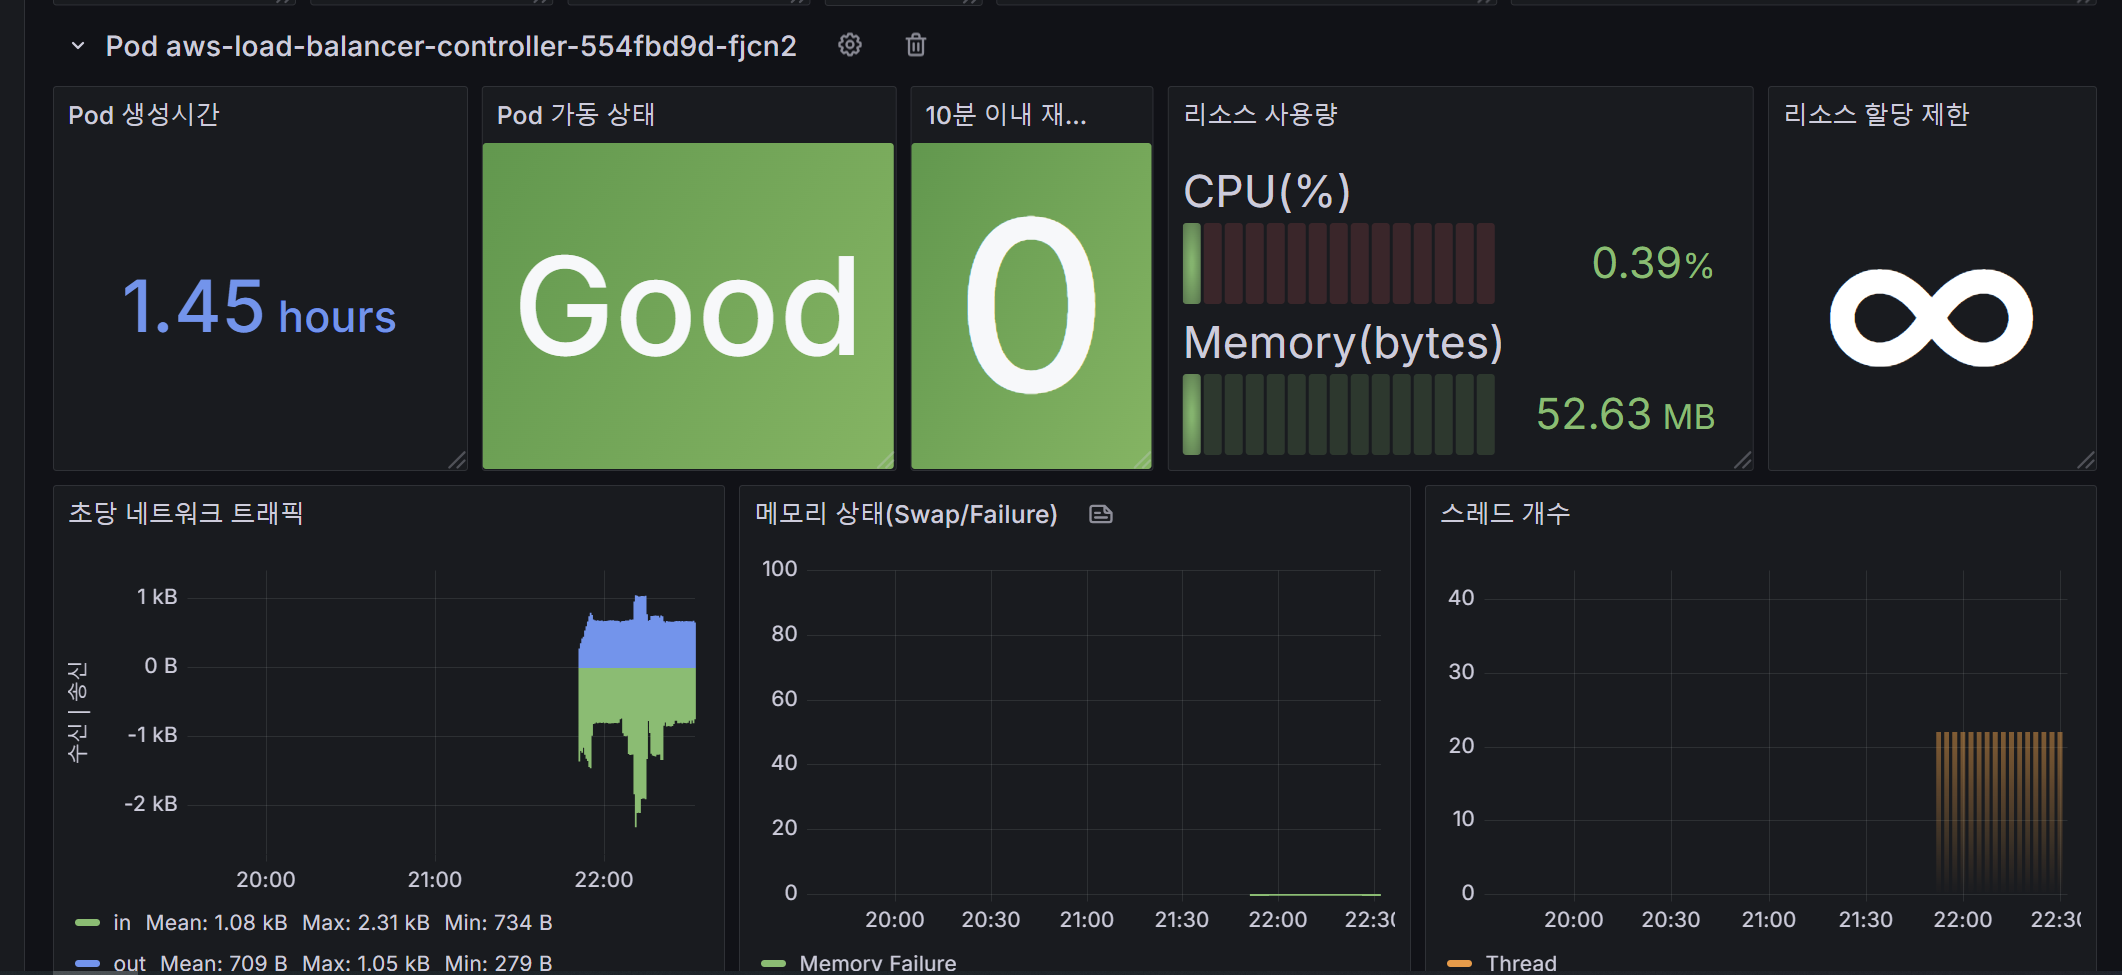
| CPU # 기존 sum(kube_pod_container_resource_limits_cpu_cores{pod="$pod"}) # 변경 전 쿼리 시도 kube_pod_container_resource_limits_cpu_cores kube_pod_container_resource_limits kube_pod_container_resource_limits{resource="cpu"} # 변경 sum(kube_pod_container_resource_limits{resource="cpu", pod="$pod"}) Memory # 기존 sum(kube_pod_container_resource_limits_memory_bytes{pod="$pod"}) # 변경 sum(kube_pod_container_resource_limits{resource="memory", pod="$pod"}) |
- [Node Exporter Full] Dashboard → New → Import → 1860 입력 후 Load ⇒ 데이터소스(Prometheus 선택) 후 Import 클릭
- [Node Exporter for Prometheus Dashboard based on 11074] 15172
- kube-state-metrics-v2 가져와보자 : Dashboard ID copied! (13332) 클릭 - 링크
- [kube-state-metrics-v2] Dashboard → New → Import → 13332 입력 후 Load ⇒ 데이터소스(Prometheus 선택) 후 Import 클릭
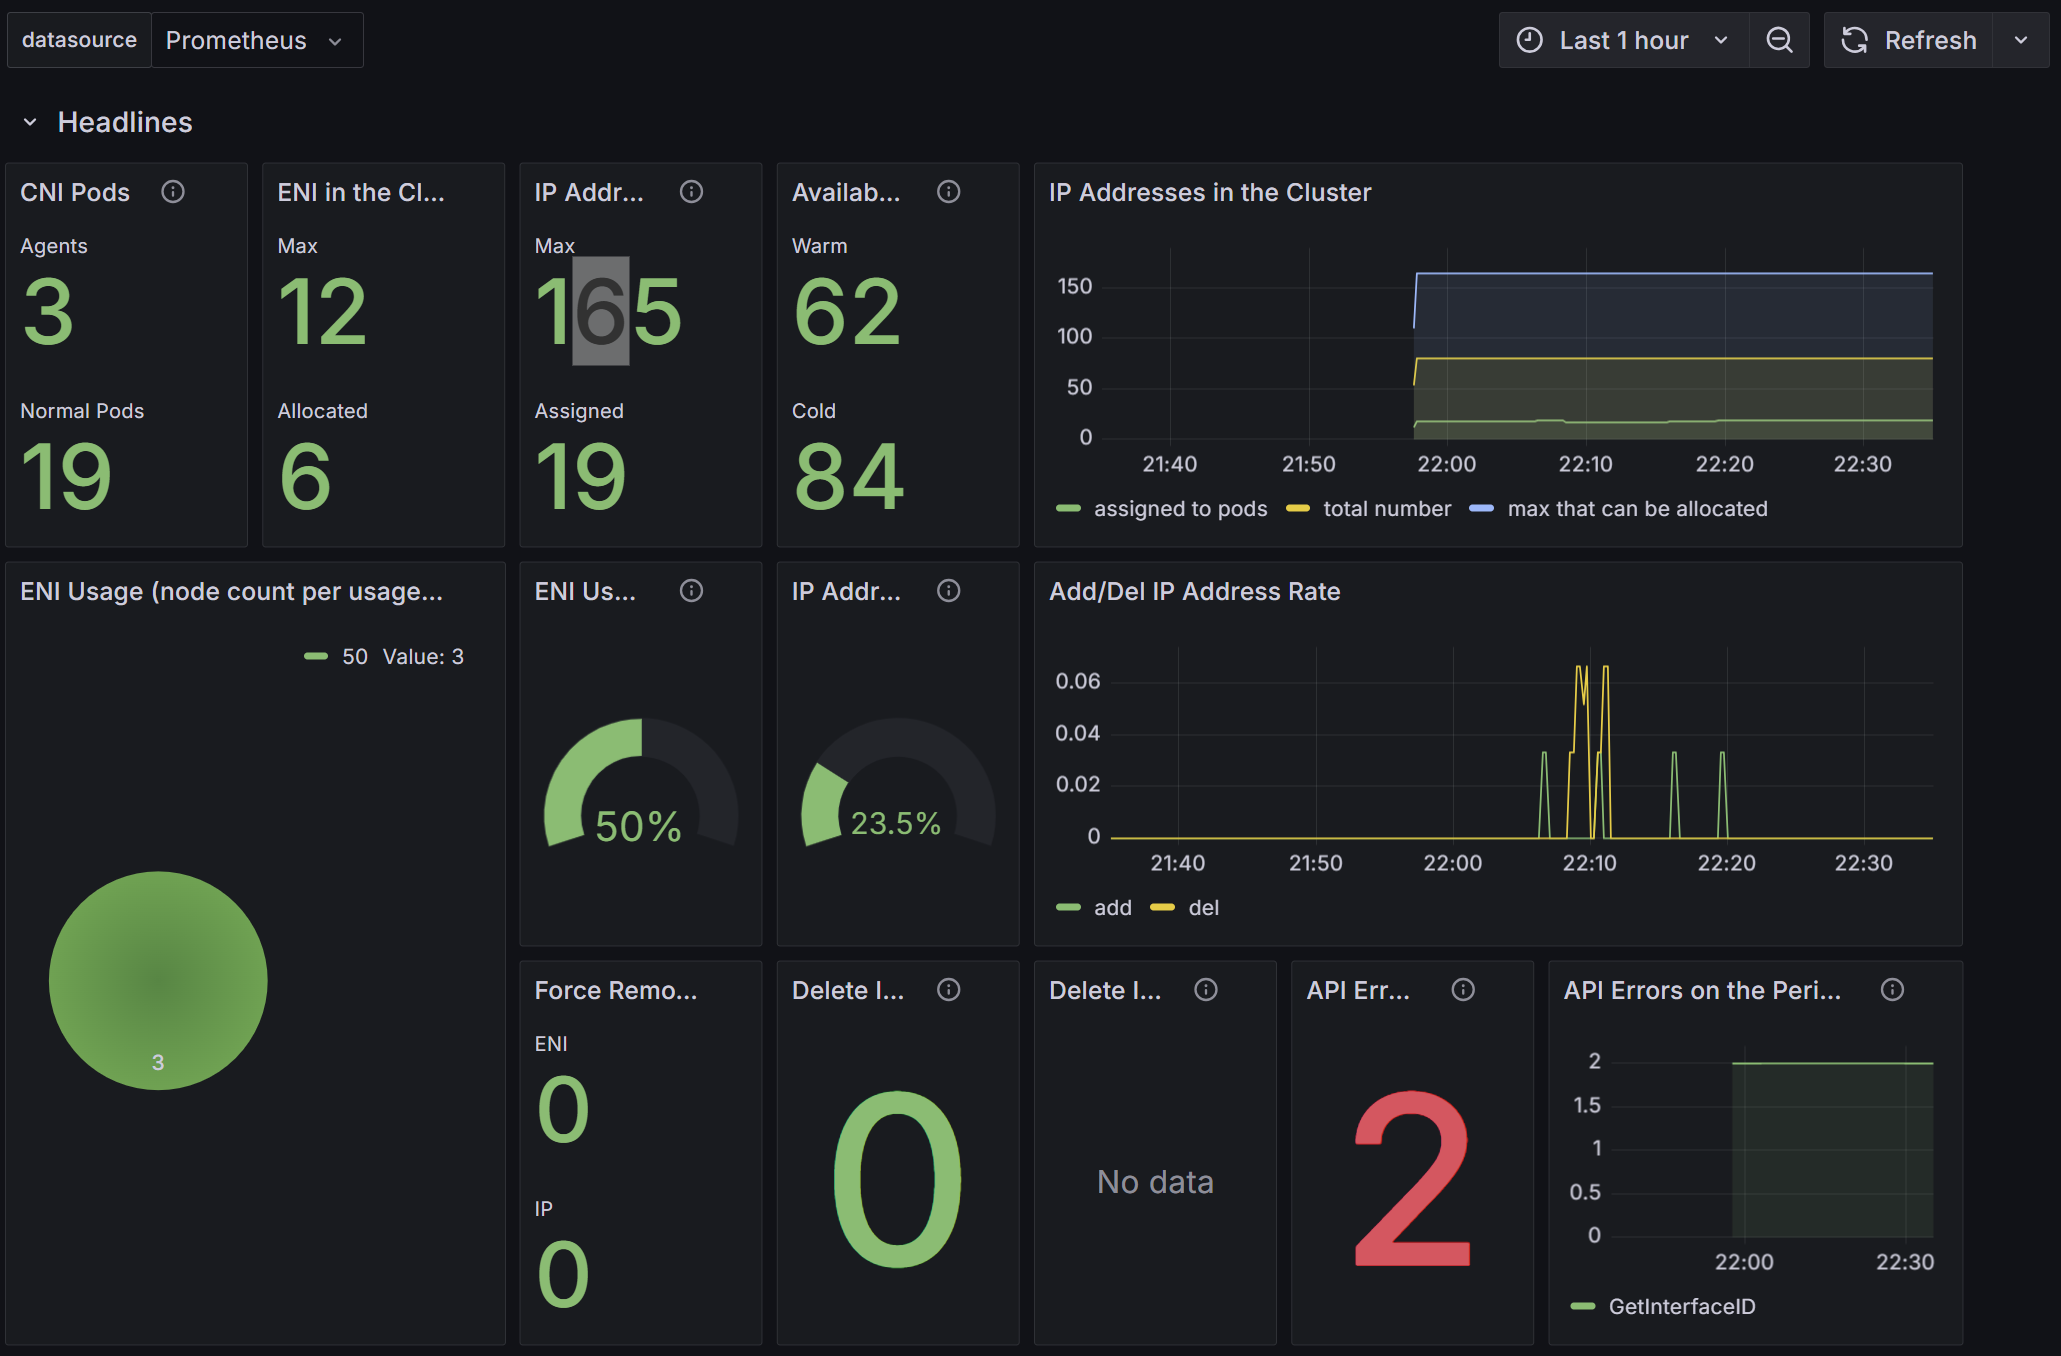
- [Amazon EKS] AWS CNI Metrics 16032
| # PodMonitor 배포 cat <<EOF | kubectl create -f - apiVersion: monitoring.coreos.com/v1 kind: PodMonitor metadata: name: aws-cni-metrics namespace: kube-system spec: jobLabel: k8s-app namespaceSelector: matchNames: - kube-system podMetricsEndpoints: - interval: 30s path: /metrics port: metrics selector: matchLabels: k8s-app: aws-node EOF |
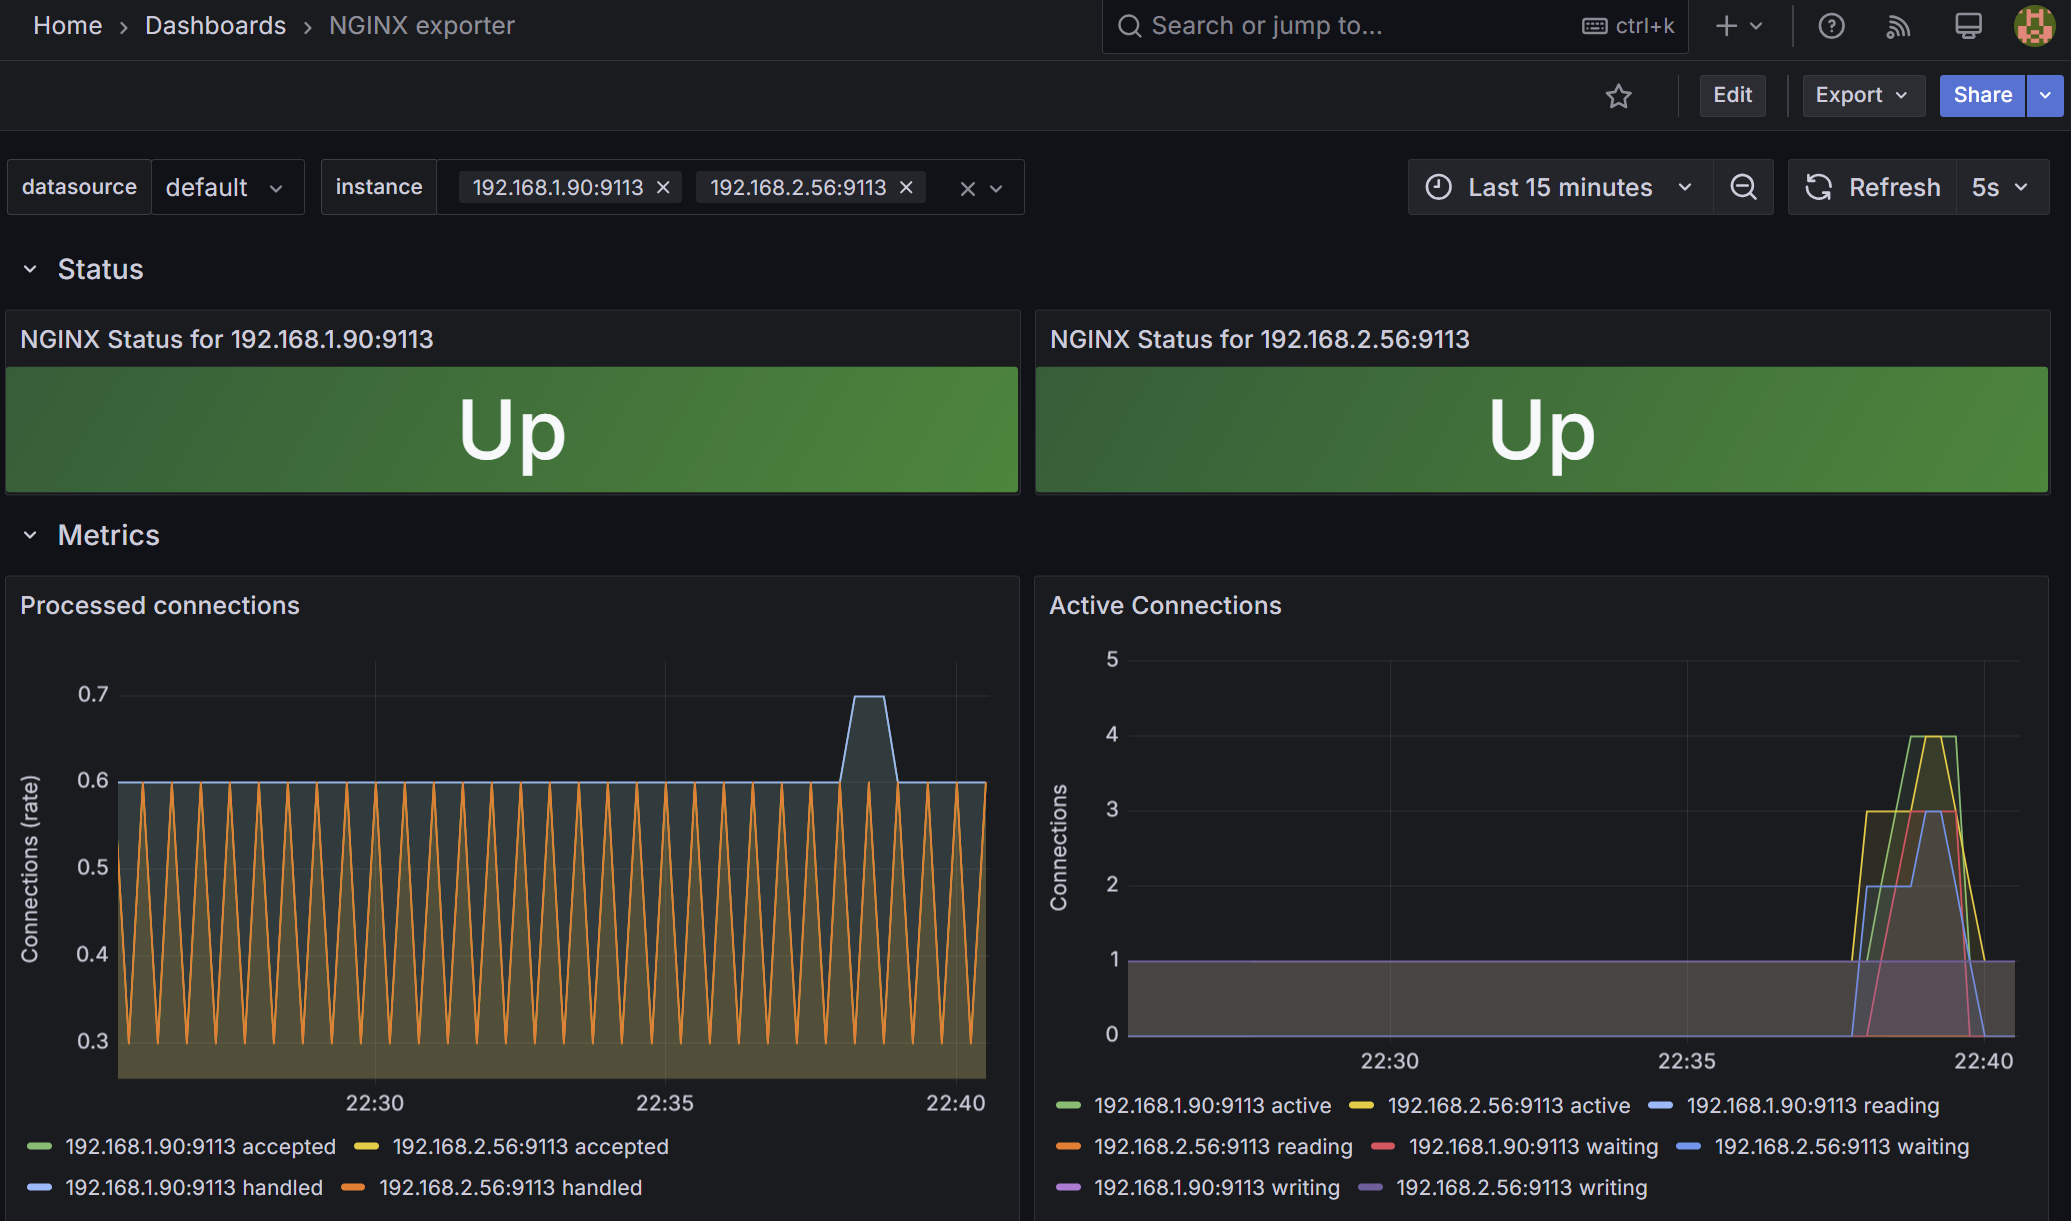
NGINX 애플리케이션 모니터링 대시보드 추가
그라파나에 12708 대시보드 추가
- kubectl scale deployment nginx --replicas 9 와 부하를 발생 시 모니터링 결과
Contact points → Add contact point 클릭-
Integration : 슬랙으로 지정 후
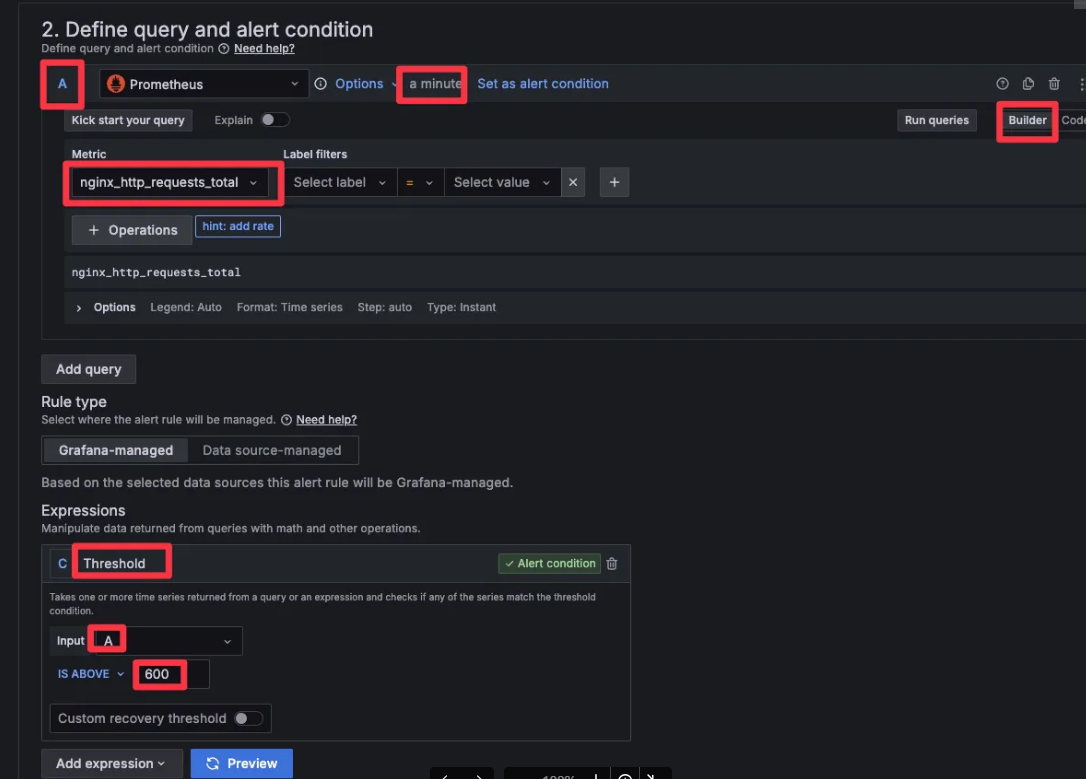
그라파나 → Alerting → Alert ruels → Create alert rule : Name(nginx alert) - nginx 웹 요청 1분 동안 누적 60 이상 시 Alert 설정
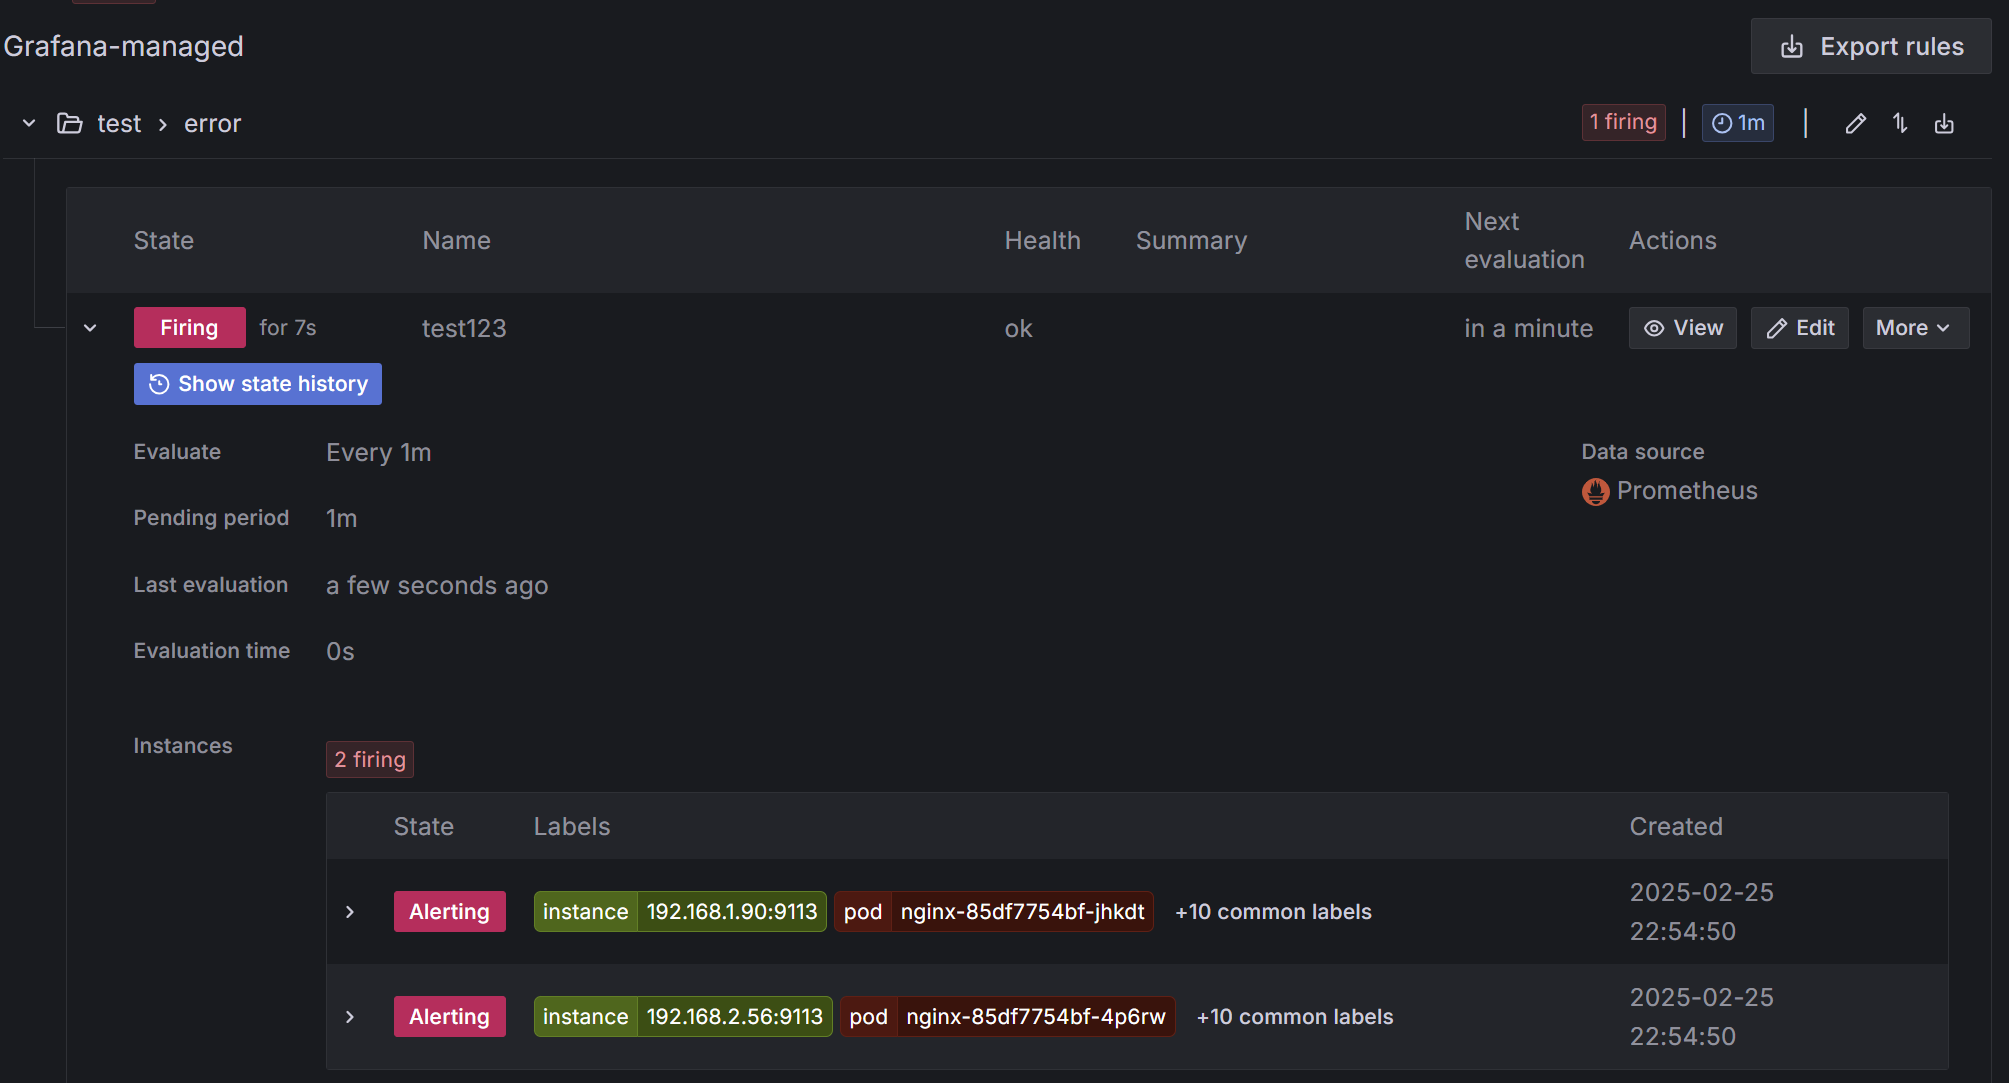
nginx 반복 접속 진행하여 알람 발생
- while true; do curl -s https://nginx.$MyDomain -I | head -n 1; date; done
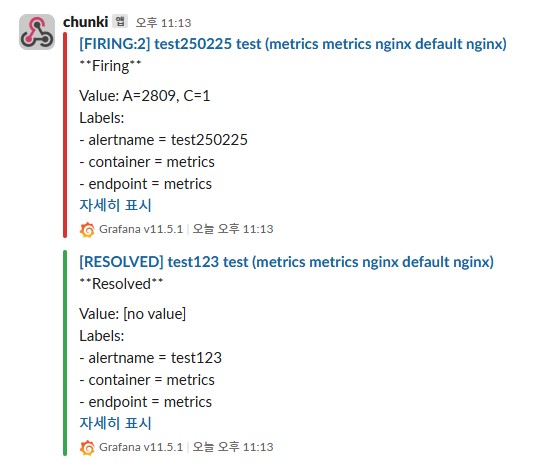
stack에 알람 발생 확인
Zabbix + Grafana vs Prometheus + Grafana 비교
| Zabbix + Grafna | Prometheus + Grafana | |
| 주요 역할 | 통합 모니터링 솔루션 (서버, 네트워크, 애플리케이션 포함) | 시계열 데이터 모니터링 및 경보 시스템 |
| 데이터 수집 방식 | Agent 기반(Push) + SNMP, JMX, IPMI 지원 | Exporter 기반(Pull) + Service Discovery 활용 |
| 스토리지 | MySQL, PostgreSQL, TimescaleDB 등 관계형 DB 사용 | Prometheus 자체 시계열 데이터베이스(TSDB) 사용 |
| 확장성 | 단일 서버 구조, Proxy를 이용한 일부 로드 분산 가능 | Federation, Sharding, Remote Storage 등으로 확장성 우수 |
| 알람(Alerts) | 트리거 기반 알람 시스템 내장 | Alertmanager 활용 (Slack, Email 등 다양한 연동 가능) |
| Grafana 연동 방식 | Zabbix 데이터 소스 플러그인 사용 (API 기반) | 기본적으로 Prometheus 데이터 소스 지원 |
| 쿼리 언어 | SQL 기반 쿼리 | PromQL (Prometheus Query Language) |
| 주요 사용 사례 | 전통적인 IT 인프라 모니터링 (서버, 네트워크 장비, 가상 머신 등) | 클라우드 네이티브 환경 모니터링 (Kubernetes, Docker, 마이크로서비스) |
| Kubernetes 모니터링 가능 여부 | 가능 (Zabbix Agent + Prometheus Exporter 활용 가능) | 기본적으로 Kubernetes 및 컨테이너 모니터링에 최적화 |
| 설치 및 유지보수 | 데이터베이스 및 Zabbix 서버 운영 필요 (설치 및 관리 상대적으로 복잡) | 단일 바이너리 실행 가능, 유지보수 용이 |
| 데이터 처리 방식 | 이벤트 기반 모니터링 (상태 변화 감지) | 시계열 데이터 기반 모니터링 (메트릭 수집 및 분석) |
| 사용자 인터페이스(UI) | 자체 웹 UI 제공 (대시보드, 알람 관리 포함) | Grafana UI 기반 데이터 시각화 |
Zabbix에서 Kubernetes 모니터링하는 방법
- Zabbix Agent 사용
- 노드(Worker, Master)에 Zabbix Agent를 설치하여 리소스 데이터를 수집
- SNMP / API 연동
- SNMP 또는 Kubernetes API를 이용하여 메트릭 데이터를 가져올 수 있음
- Prometheus Exporter 연동
- Prometheus Node Exporter, kube-state-metrics 등을 활용하여 데이터를 가져온 후 Zabbix에서 처리
- Zabbix + Prometheus 통합
- Zabbix가 Prometheus 데이터를 가져와서 사용할 수도 있음 (Zabbix Webhook을 통한 Alertmanager 연동 가능)
Zabbix도 Kubernetes 모니터링이 가능하지만 Prometheus만큼 자연스럽거나 최적화된 방식은 아니다.
어떤 경우에 Zabbix, Prometheus를 선택할까?
- Zabbix가 적합한 경우
- 기존 IT 인프라(서버, 네트워크, VM 등)를 모니터링해야 하는 경우
- SNMP, JMX 등을 통한 하드웨어 및 서비스 모니터링이 중요한 경우
- 장기간 데이터 보관이 필요한 경우 (SQL 기반 DB 활용)
- Prometheus가 적합한 경우
- Kubernetes, Docker, 클라우드 네이티브 환경을 모니터링해야 하는 경우
- 실시간 메트릭 수집 및 알람 시스템을 구축해야 하는 경우
- 대규모 확장성과 빠른 데이터 처리가 필요한 경우
결론적으로, Zabbix는 전통적인 IT 인프라 모니터링에 강하고, Prometheus는 클라우드 및 컨테이너 환경에 최적화되어있다.
후기
Cloud Watch 데이터를 Zabbix에 저장해서 모니터링 및 알람 + elasticsearch 로 모니터링하였는데 프로메테우스를 활용할수있는 방법을 알수있어 좋았고 현재 운영하고있는 인프라에 적용하는 방법을 고민해봐야겠다.